I got accepted to CXL institutes’ conversion optimisation mini-degree scholarship. It claims to be one of the most thorough conversion rate optimisation training programs in the world. The program runs online and covers 74 hours and 37h minutes of content over 12 weeks. As part of the scholarship, I have to write an essay about what I learn each week. This is my twelfth and final report.
Retention is a measure of how often people come back and use your product after they first sign up. If people don’t stick around after they sign up then any work at the top of the funnel isn’t really going to matter over the long term.
You can spend more on customer acquisition#
If you work on your retention you are going to be able to keep more users for longer. This means you can afford the higher cost of acquisition at the top of the funnel and that becomes a competitive advantage.
It improves virality#
The longer you retain users, the more opportunities for that user to share it with other people and bring new users into their product. As you increase virality, you decrease your cost of acquisition which once again gives you a
competitive advantage.
It decreases your payback period#
Improving retention means improving your conversion to paid in things like freemium products. The longer you retain a user the more opportunities you also get to upsell that person. The more money you make per user the faster you can recover the cost of acquiring them.
The point is that every improvement that you make to retention has an effect across all of the other pieces of your funnel whether that’s around virality, the cost of acquisition or your LTV payback period.
So how do we improve retention?#
Well, the first thing that we need to do is measure it.

I hate looking at cohort tables because I feel that they are hard to make sense of. So I typically translate them into a retention cohort curve instead.
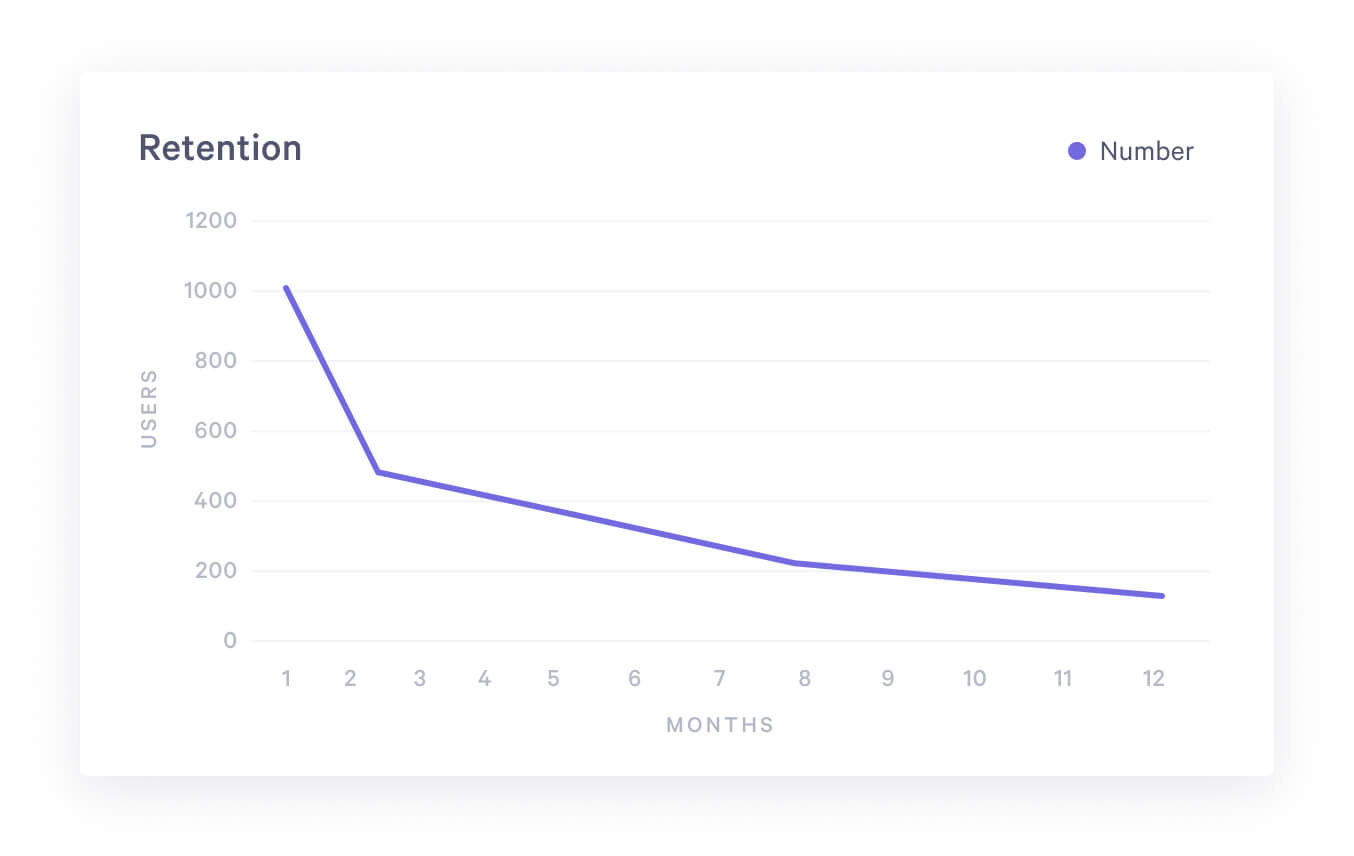
This chart plots out the percentage that remains active over time. So if the chart hits 400 in month four that means 400 of the initial 1000 users are still active on the platform 4 months later.
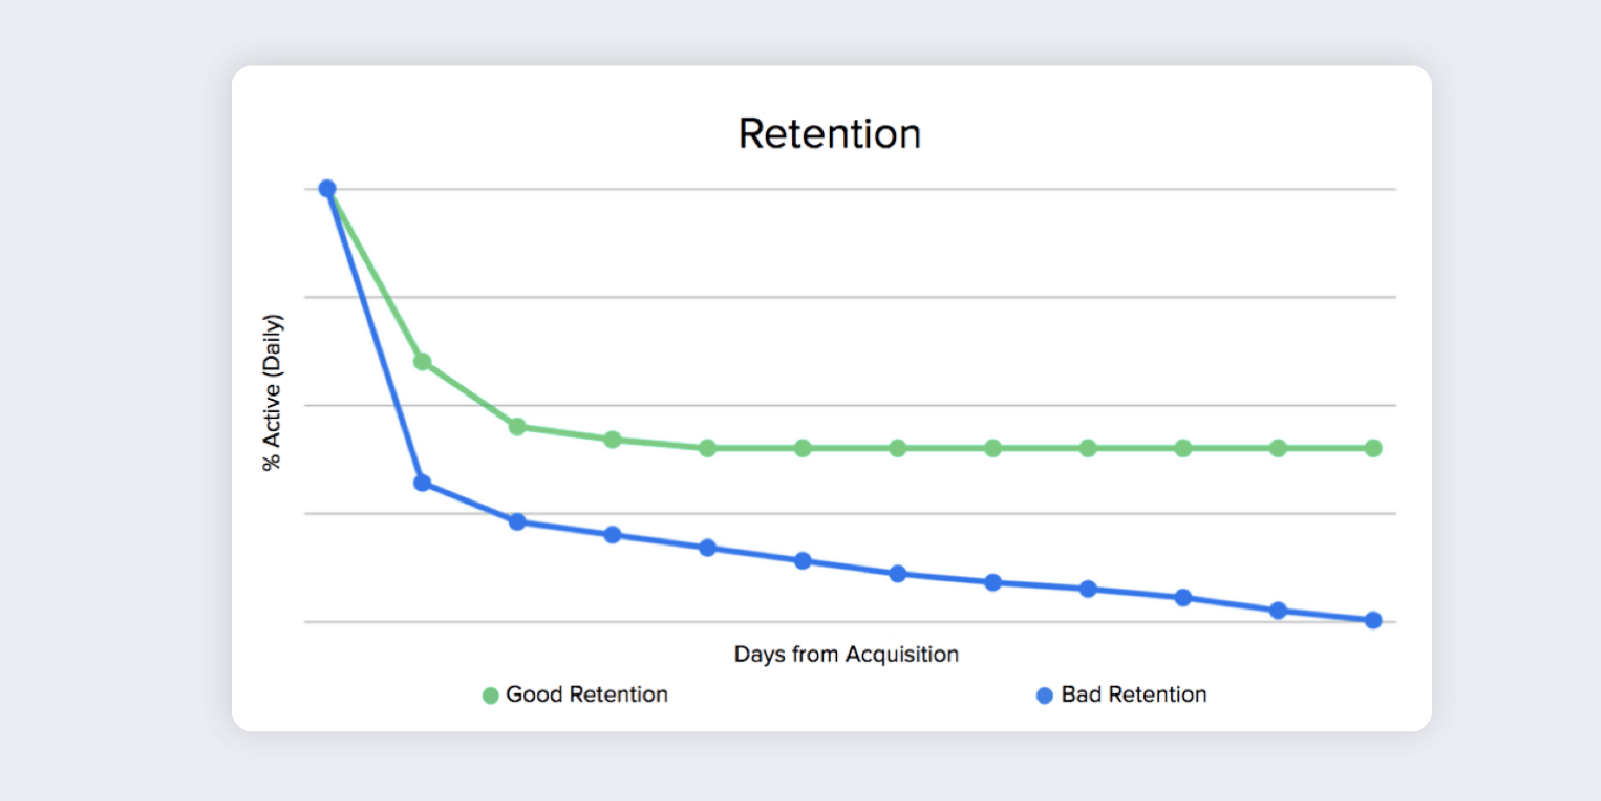
The chart above has two different retention curves. The difference between them highlights the most important thing to look for in retention. A good retention curve flattens off or gets pretty close to flat like the green line above. A bad retention curve trends toward zero like the red line does.
If you have a retention curve that turns toward zero you actually have to ask a different question before you go into the optimization process because it might be a product-market fit problem and not an optimization problem.
Retention curves are actually the best quantitative indicator of whether we have product-market fit or not and of course if we don’t have product-market fit no amount of the optimization is actually going to help help the problem.
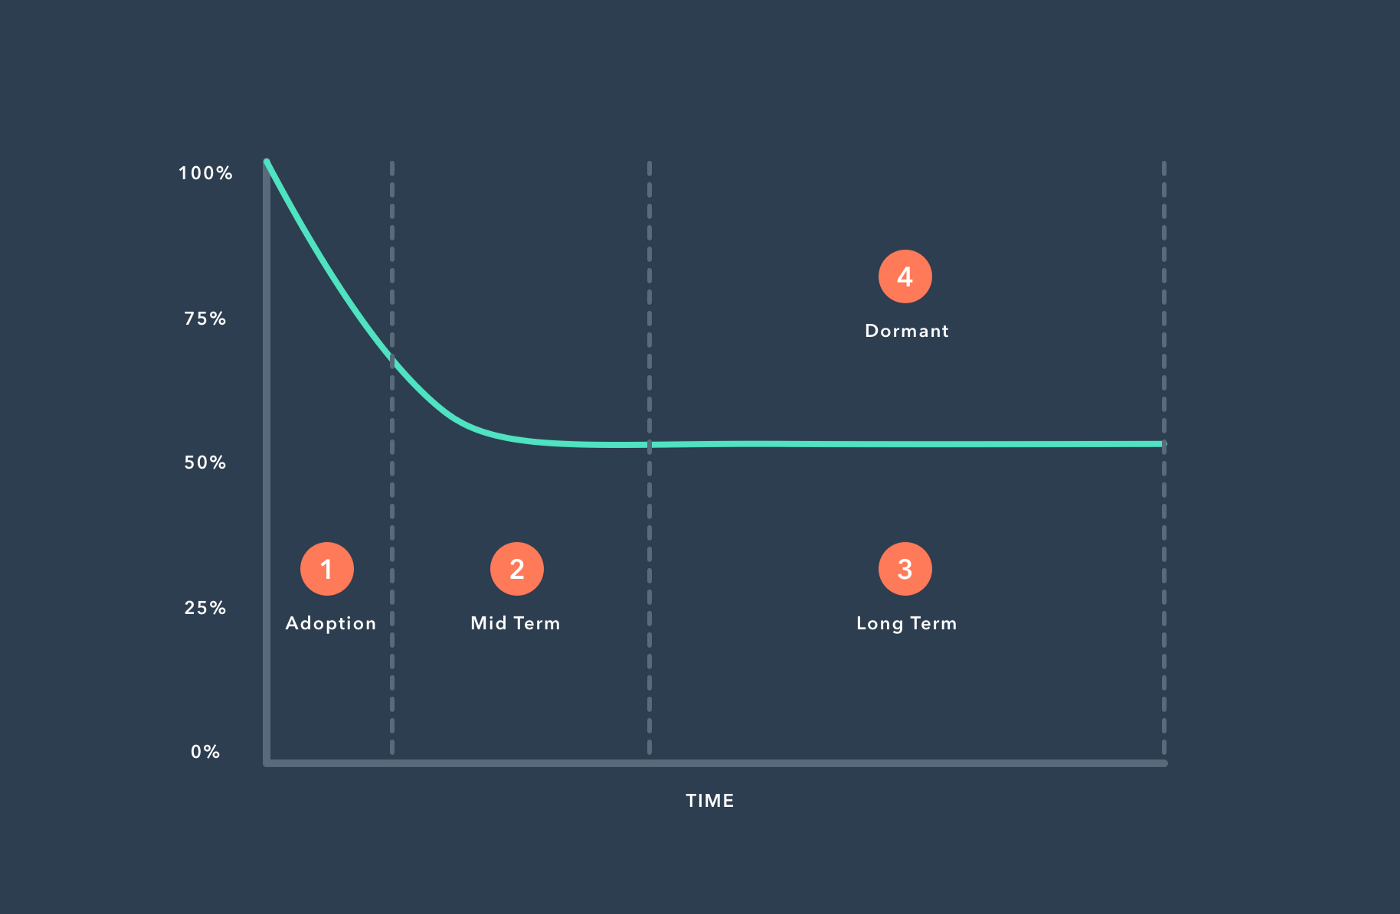
The next step is to break the curve down into more actionable pieces. Retention actually has four stages.
Onboarding#
This is the new user experience that might be day one, week one or month one depending on the natural usage behaviour of your product. The goal here is to get users to experience the core value as quickly as possible.
Mid-term retention#
Once we get them to experience the core value, the second thing to do is to create habits around that core value.
Long-term retention#
The third stage of retention is where we get users to experience this core value as often as possible over a long period of time. Once we build that habit up we need to get people to continue to invest in that habit over time.
Resurrection#
The last, and often overlooked, stage of retention is resurrection. this is when you reactivate dormant users and reengage people who have lost interest in your product.
Once you have broken your retention chart into sections, improving each stage of retention involves three basic steps:
- Segmentation
- Looking at what people do
- Listening to what people say
Segmentation#
To understand what is going on in a p[articulate stage of the curve you want to segment it in as many ways that you possibly can. Tools like Mixpanel and Amplitude make this easy. Depending on the data you collect you can segment retention
- by user source
- the landing page that they came through,
- the technology that they’re using,
- by persona,
- by the actions that they might have taken in their first use, all these all
- acquisition source
- type of email
They all tell a different story.
On the one hand, specific segments can be underperforming and pulling your average down. It might make sense to stop investing in those segments (for example people who use sign up with free email accounts vs work email accounts). This makes sense when all your other segments are performing fine and a single segment is pulling the average down. This usually means it’s actually an acquisition problem. The other way to look at this is to say, ok, how do we take our lowest retaining segments and improve them?
Looking at what people do#
The next step involves looking for quantitative indicators between healthy users and non-healthy users. How many emails were sent with the product on the first day if we compared the healthy users that retained to the non-healthy users the people who dropped off? What actions did they take? What actions did they not take? What quantitative differences are there between the healthy users and the unhealthy ones?
Listen to what they say#
When you have found a trend the next step is to speak to the people in that segment. Analytics will show you what people are doing but you will need to speak to people if you want to understand why they did it.
So that’s it. You measure retention. Break it down into stages. Segment users in each stage to look for trends. Then analyze the difference between healthy users and non-healthy users in that trend. Then speak to people to understand the motivations and reasons around the behaviour in question. All of this information should give you a clear hypothesis of what you could test to fix the situation. You then design and run the experiments to disprove your hypothesis.
Of all of the stages, optimizing for the new user experience is the most important because people form opinions fast and they’re really hard to change once they are set. Any kind of improvement to the new user experience can drive the entire curve up. Onboarding is important.
Links#
- Most of this post came from this talk by Brian Balfour.
- An introductory article on how to do customer interviews
- An introductory article on how to do user testing
- This is post 12 in a series. The rest of the posts are listed here.
- This is the CXL Institute’s conversion rate optimisation program
