The reason I like retention curves is because they pack an incredible amount of information into one image.
They tell you if a product has found fit straight out of the gate.
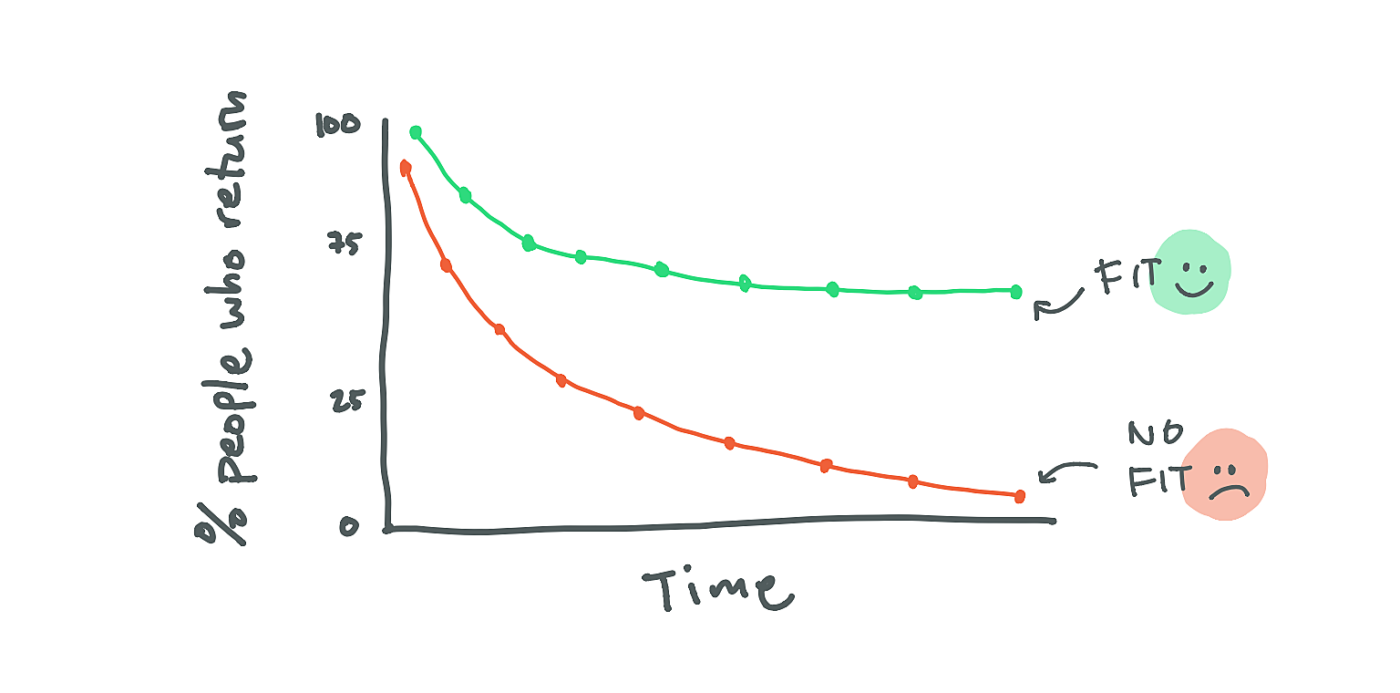
When a retention curve draws to zero you have a leaky bucket.
When your curve flattens out then you know your users have developed enough of a habit around your product to continue to derive value out of it on a recurring basis.
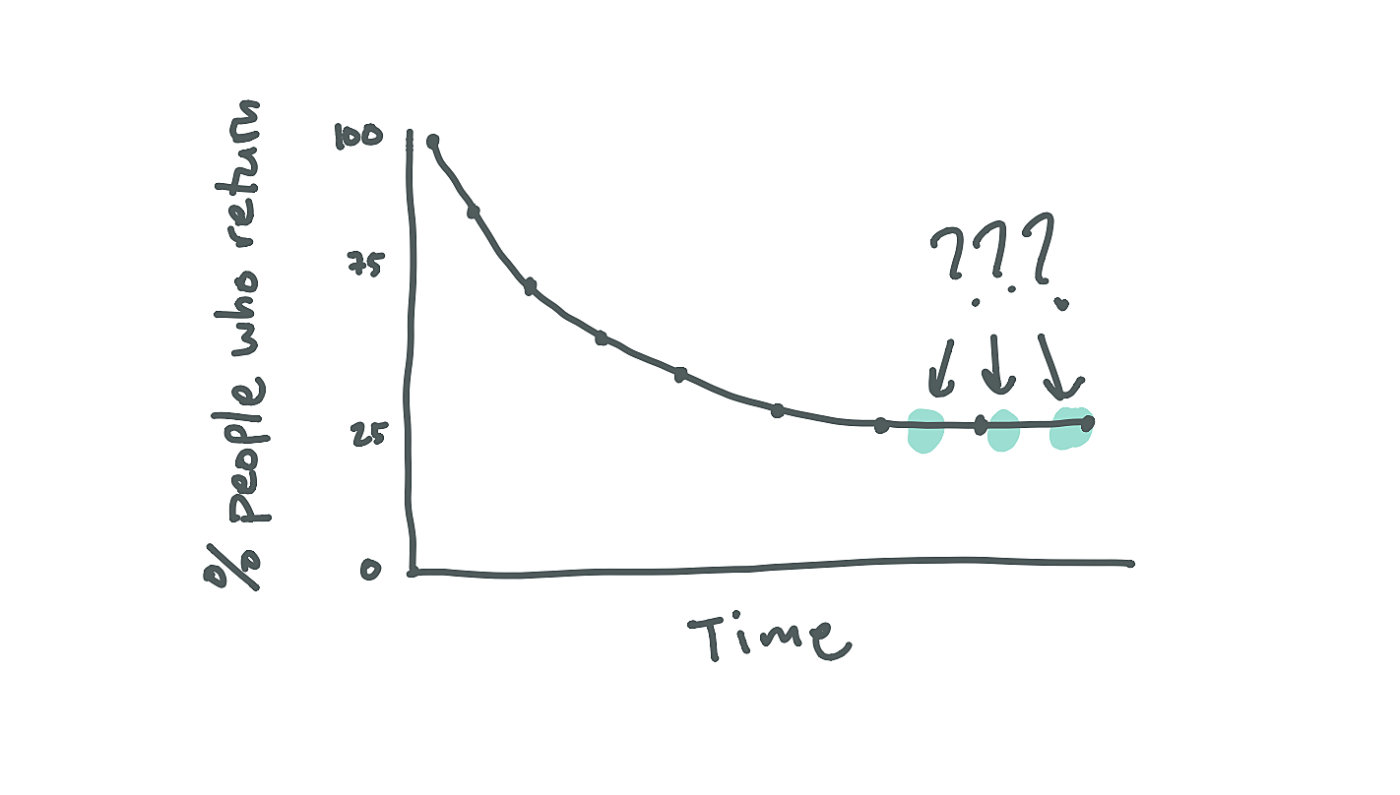
How long your line takes to flatten out tells me how long it takes to build a habit around your product.
Everything on your curve up to the flat bit is your onboarding experience.
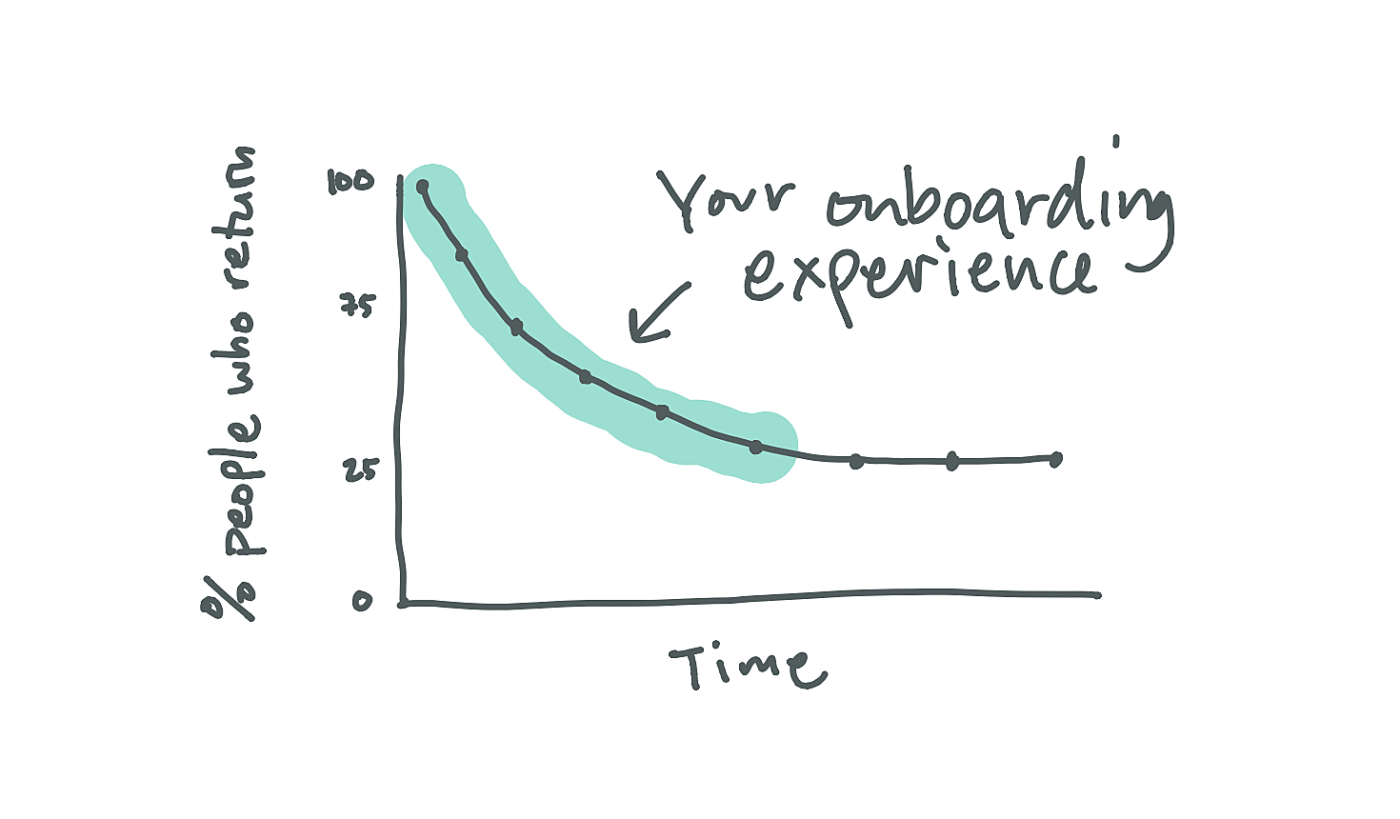
Onboarding, activation, your first run…call it what you want. What matters is how steep this curve is. A steep curve means people find it hard to figure your product out.
When your curve flattens, there isn’t a specific point where you measure retention. It’s usually about 3 to 6 months in but wherever you plant your flag can then be used as a baseline for improvements. I also like to use Lenny’s post benchmarks to see how well you compare to your industry.
Retention is the single better indicator of the quality that I know of.
I am yet to find a measure that gives me a more succinct picture of a product’s overall health.