
Three weeks ago I got accepted to CXL institutes’ conversion optimisation mini-degree scholarship. It claims to be one of the most thorough conversion rate optimisation training programs in the world. As part of the scholarship, I have to write an essay about what I learn each week. This is my third report so far.
In my experience, the majority of people who have analytics set up use it to see how much traffic their website is getting. This is a shame because, with a little bit of effort, it can tell you so much more useful information. Over the next 10 minutes I’ll show you how to understand where your traffic is coming from, and what your conversion rate for each source of traffic is.
How Google Analytics Buckets Your Traffic
To make sense of your analytics you must understand that there are 9 default types of traffic.
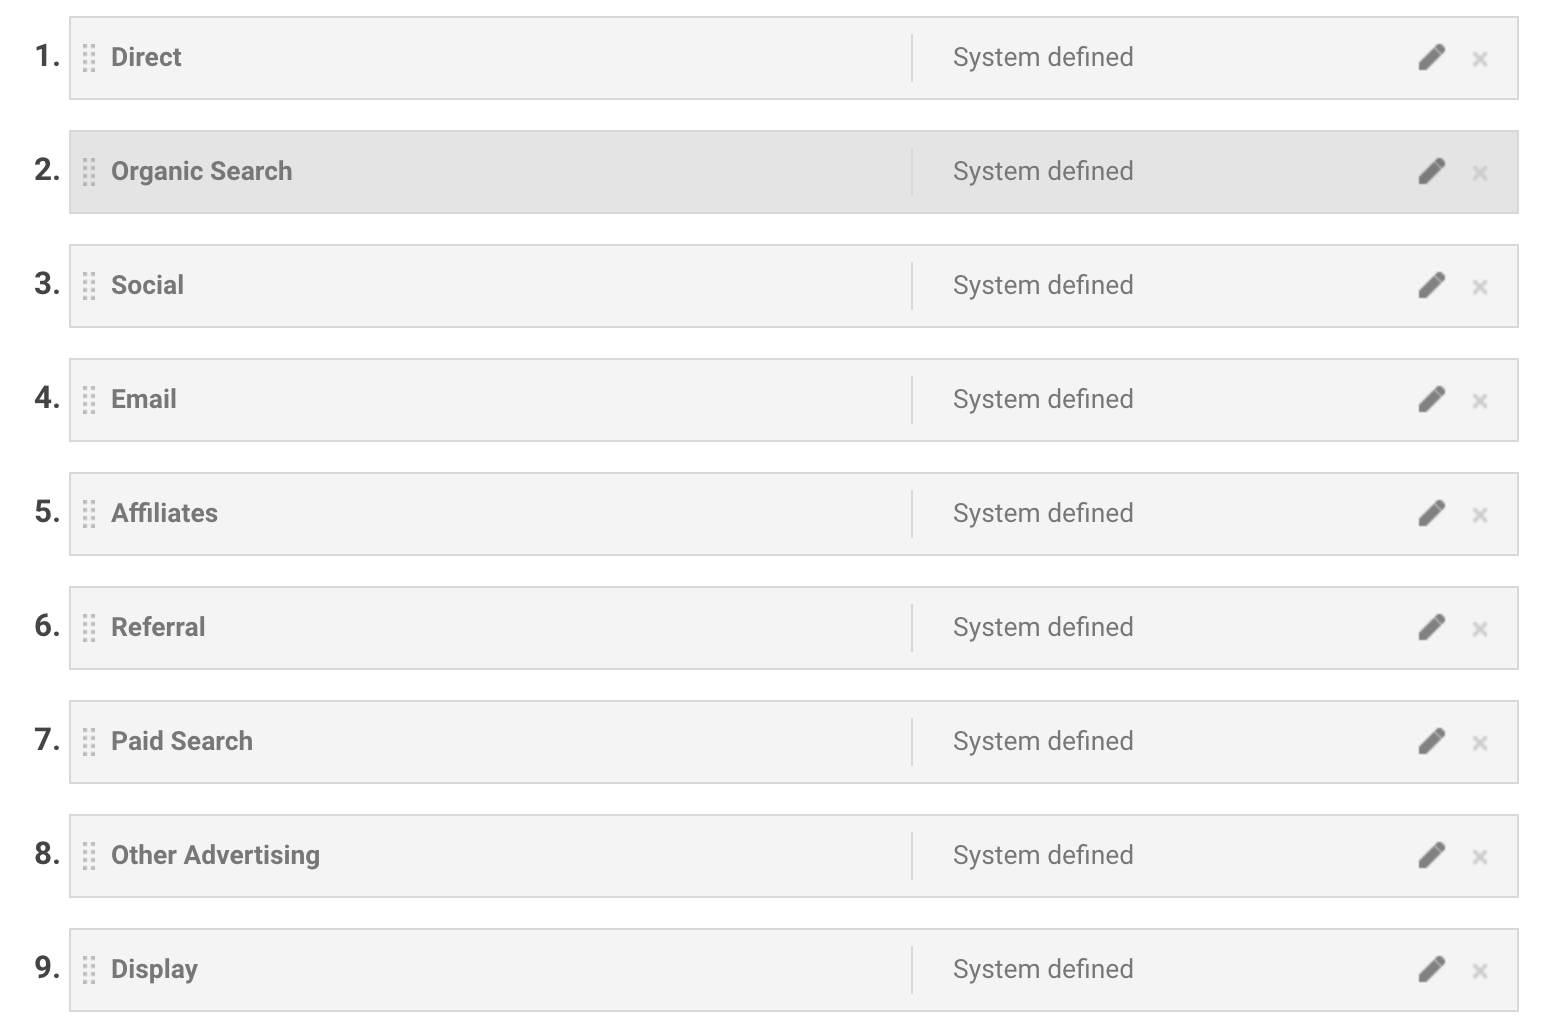
I prefer to think of these as five main groups:
- Organic – If someone finds your website on a search engine then it counts as organic traffic.
- Referral – When someone comes to your site from a link on someone else’s website then that’s referral traffic.
- Social – If traffic comes from a link shared social media platforms like Facebook or twitter then it’s Social.
- Email – this is when someone clicks on a link in an email you’ve sent out.
- Ads – Display, Paid Search, Affiliate marketing and all other advertising counts as paid advertising.
The reason I’ve simplified it down to these categories is because it reflects the three main ways people get traffic online:
- You can produce amazing content and work on getting it ranked on search engines to get organic traffic. This takes time, effort and dedication but once you get ranked the traffic keeps coming.
- You can work on sharing links to your website on forums, in comments and discussions, and any other place you can find a relevant audience for your product. Referral traffic works instantly, but people’s attention churns just as fast so you have to stay at it constantly. Technically, Social is just referral traffic but I like the distinction because people who follow you on social media are already in your orbit. Typically, with other referral traffic you are putting yourself out there and exposing yourself to an entirely new audience. The same rules apply to Email, technically this is referral traffic, plus these people are already in your orbit since they are on your mailing list. Still, the category is practical because it keeps the referral category cleaner by not diluting it with email traffic.
- Then you have paid advertising. If you don’t want to hustle, you have to pay for your traffic.
These categories are just Google’s default buckets, you can create your own. Lots of people promote their products via public speaking, networking, trade shows, etc; you can set up custom categories so that traffic from these efforts don’t end up in another category. For example, if I want to do a cold email outreach campaign then I could label this under the default Email category, but I associate email with my mailing list. Instead I could create an entirely new category called Outreach and have all my cold email traffic show up there.
Lastly, direct traffic, this is when someone types your URL directly into the browser. This is more of a catch-all for when Google doesn’t know where the traffic is coming from. If you give business cards out at networking events, there is no way that Google can know this, so it will just get lumped under direct traffic. The way to solve this is to teach Google where your traffic is coming from.
How To Teach Google Where Your Traffic Is Coming From
Google does a fair job of figuring out where your traffic is coming from. However, with the networking example above, it is impossible for Google to know that you met someone at an event. The solution here is to use UTM links. A UTM link is like a regular website link except that it has a string of information appended to the end of it (UTM stands for Urchin Tracker module, Urchin was the name of the company before Google acquired it).
For example, the link to this article is https://joshpitzalis.com/ga
A UTM link would be https://joshpitzalis.com/ga?utm_medium=referral&utm_source=my-blog-demo-link
If you click on the first link it will just show up as any referral traffic in my Analytics, clicking on the second one will tell me that you clicked on the demo example link on my blog. That string of information at the end, after the ? tells Google the source of the traffic and how you want to categorize it.
Creating a UTM link is not complicated, you can just use a UTM link generator. I’ll link to the one I use in the footer. Most people also use link shorteners to mask these long ugly links.
All you have to do is add the original link to the first field in the generator and then enter the relevant information for the source of the traffic. You are given 5 fields to fill out. I’m not going to explain what all the fields do because you only need to know two to get started: Source and Medium.
The source is where your traffic is coming from. If you parse through the example UTM link above you’ll see that it says utm_source=my-blog-demo-link in the string. This means my-blog-demo-link is the source and that is what will show up in my analytics dashboard when people click on this link.
The medium refers to the 9 default categories we were talking about earlier. In this case, it’s a link in a blog so I’m labelling it referral traffic. It is important to use lowercasing when defining a medium otherwise it won’t work. The default categories are a known convention so I suggest sticking to one of the category names when possible. Unnecessarily creating your own makes it’s harder for new people to understand your analytics in the future.
Telling Google the Medium will give you a traffic pie chart that looks something like this in the Acquisition > Overview pane.
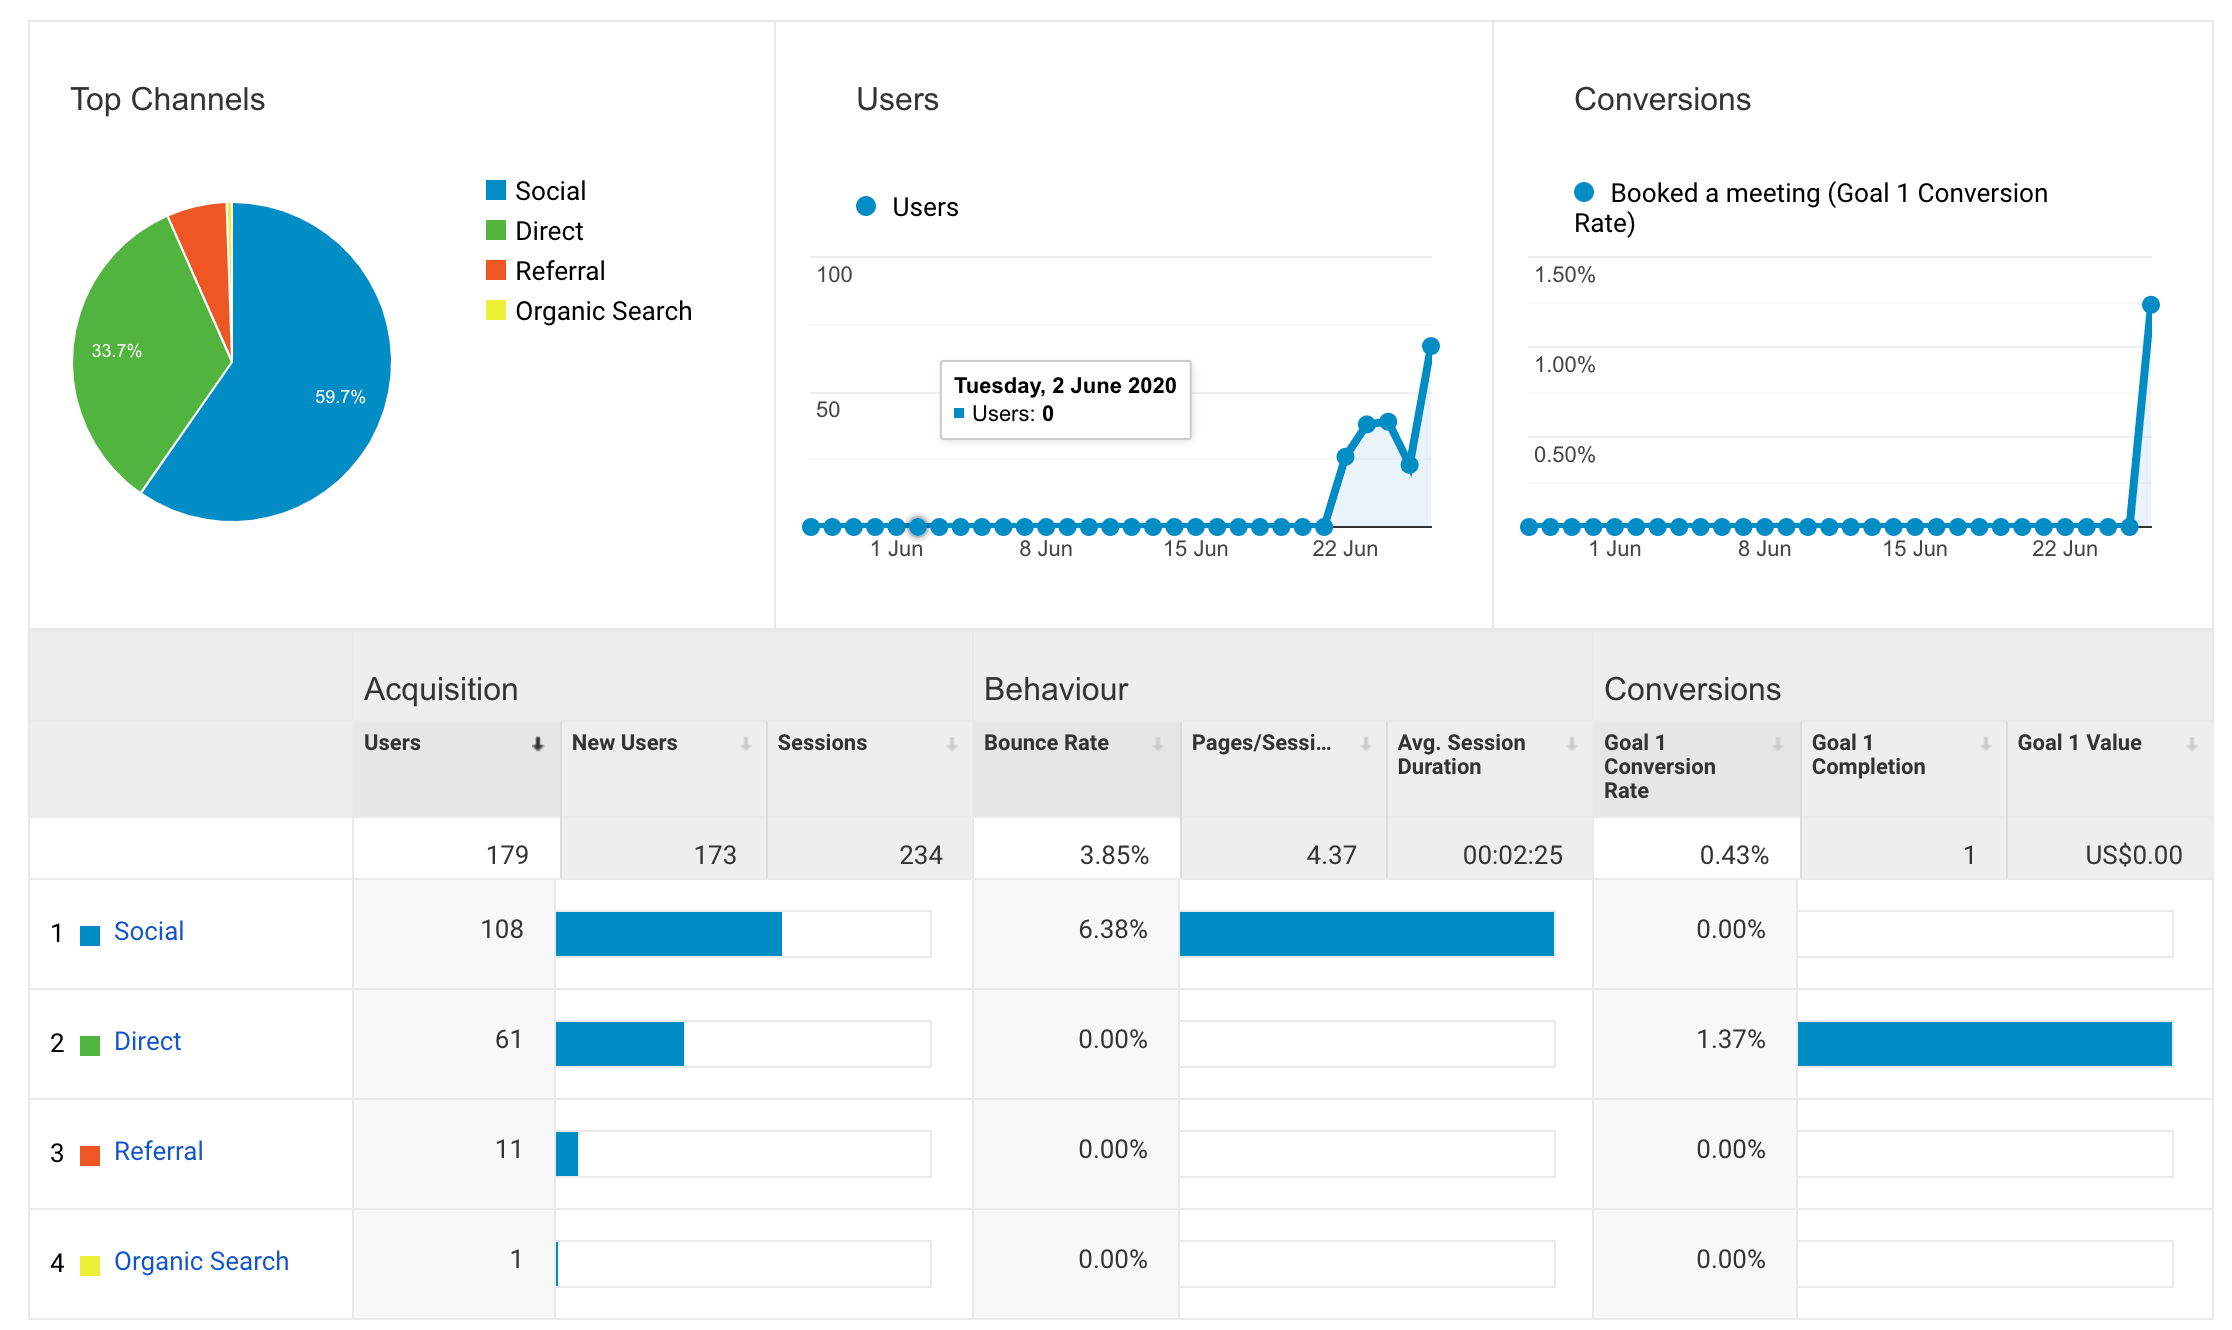
The colourful pie chart in the top left corner tells me that more than half of my traffic is Social and 6% of it comes from referral. On the other hand 33% of it is labelled ‘Direct’, this is because I hadn’t started using UTM links for that traffic and Google doesn’t know how to categorize it. This is why it makes sense to start using UTM links as soon as you can.
If you then click on one of the Mediums in the table, for example Social, it will show you all your sources of social traffic.
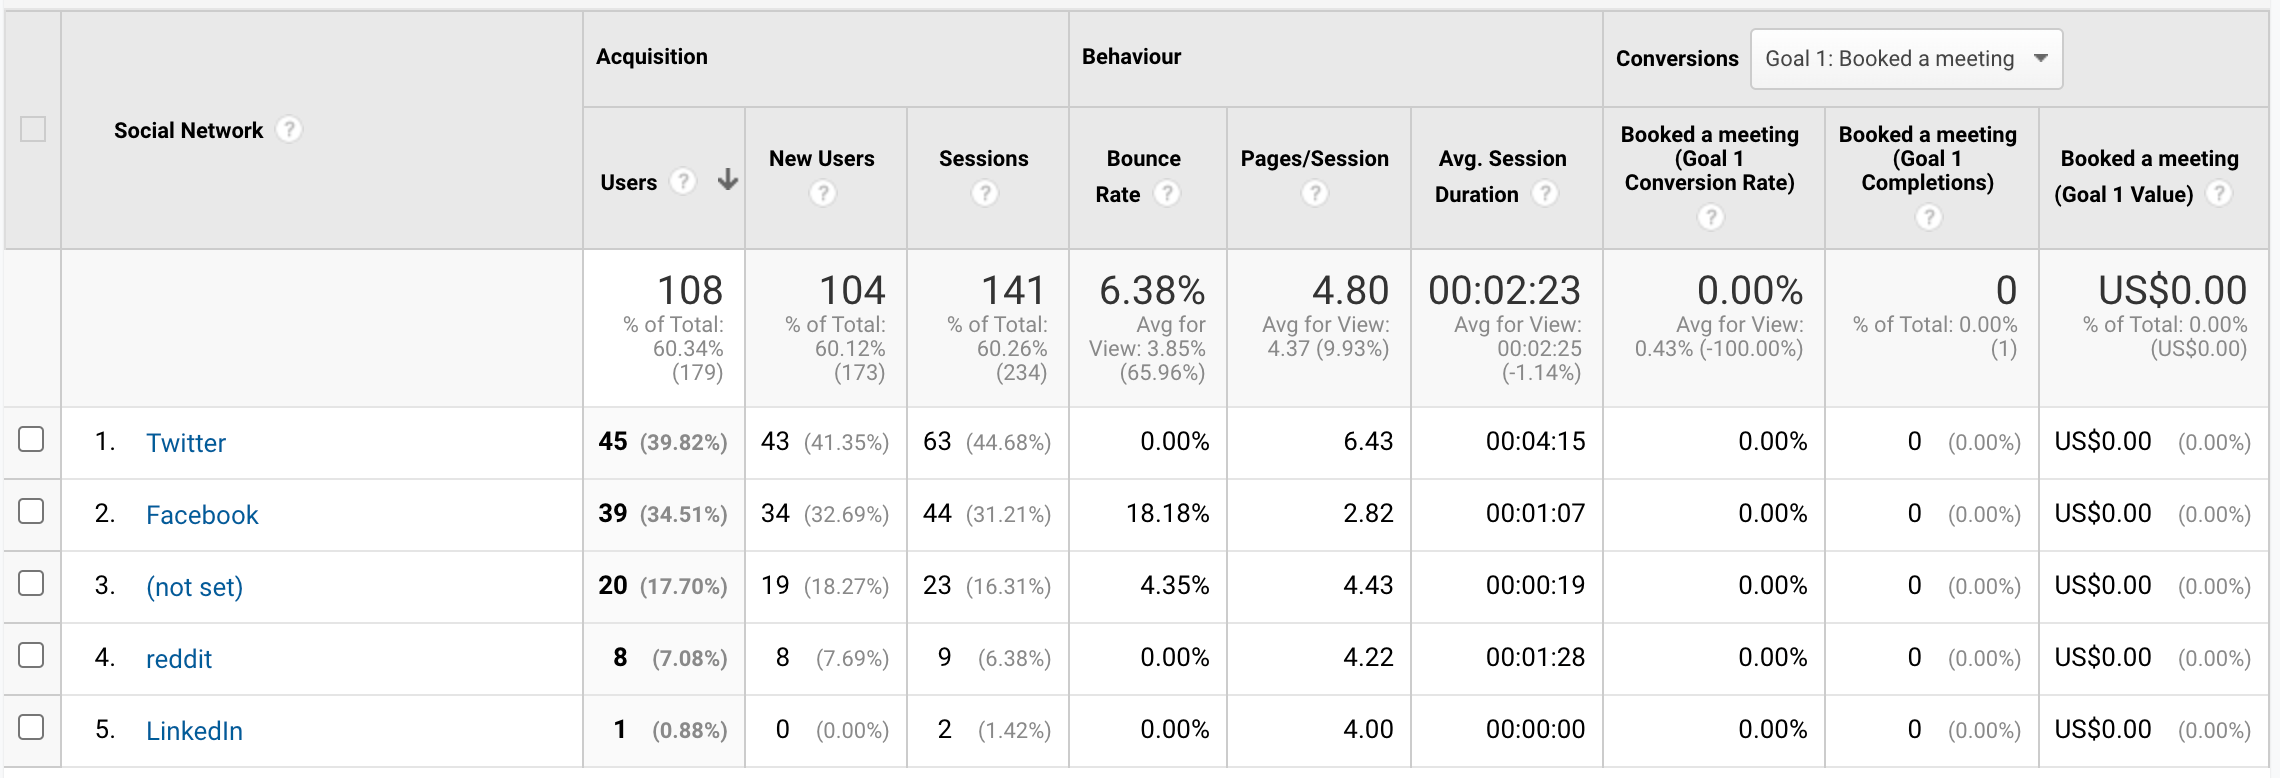
Twitter and Facebook are my top two sources of traffic and about 17% of the traffic is ‘not set’. Again, this illustrates why it makes sense to start using UTM tags.
Cleaning Up Fractured Traffic#
The view I like to spend most of my time on is Acquisition > All Traffic > Source/Medium.
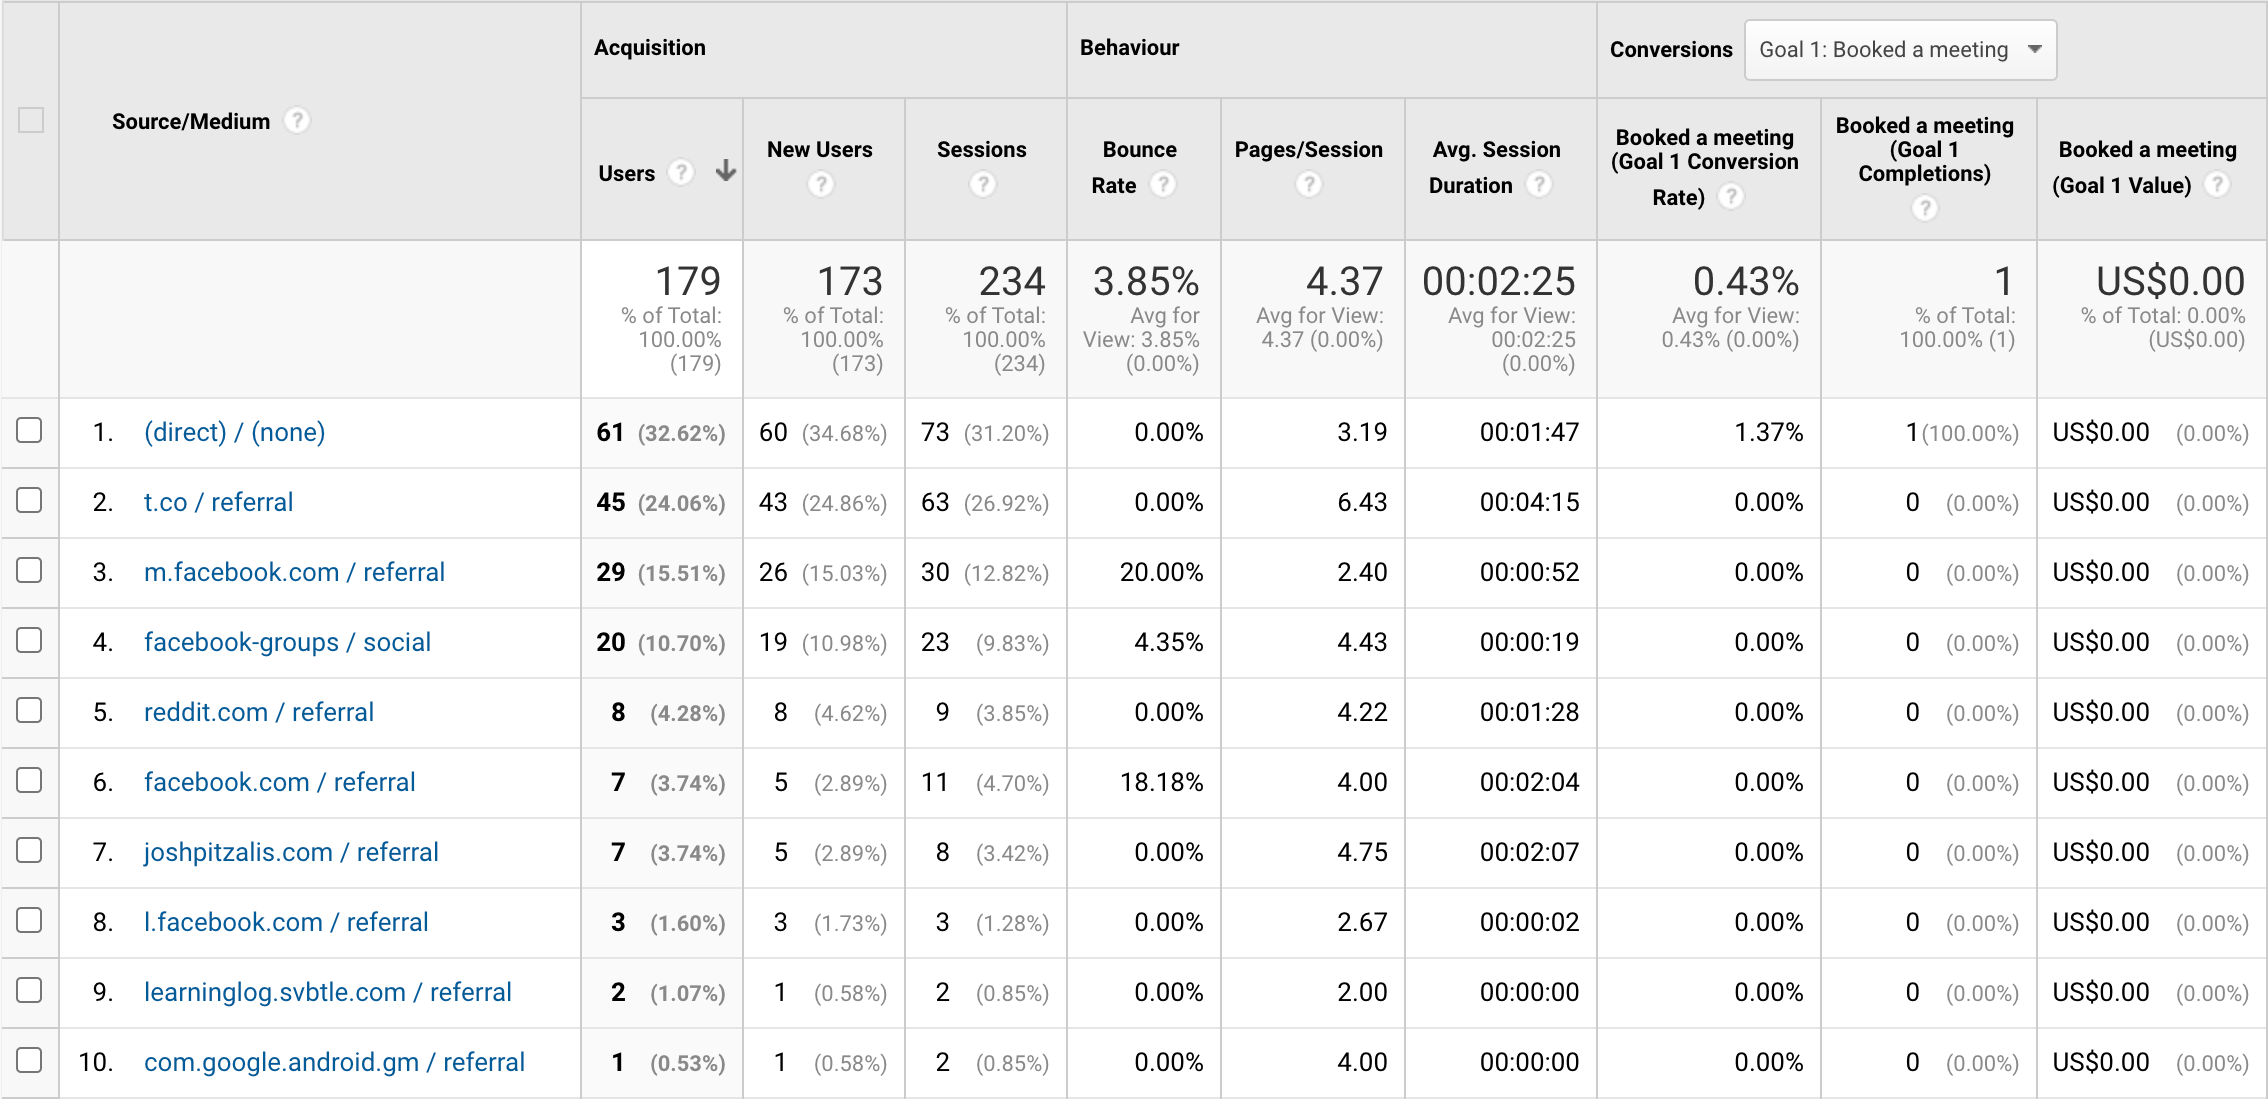
The first column shows me my top 10 sources of traffic sources and their medium. The rest of the columns then help me understand how that traffic is performing.
This table is a bit messy because there are 3 rows with the same sources. There facebook.com, m.facebook.com and l.facebook.com. This happens because facebook uses different servers for different views. This is unhelpful. What I want is a single row that just tells me how much traffic I am getting from facebook.
The way to clean this up is to use a filter.
Go to your test view before you create a new filter. If you don’t have one, set one up before you start adding filters. Filters can be dangerous, once data starts getting filtered out there is no way to retrieve it, so you want to set up a test view where you can test the filter works as expected before applying it to all your analytics data.

In your test view, create a new filter, give it a name and then click on the custom tab and then select the search and replace option.
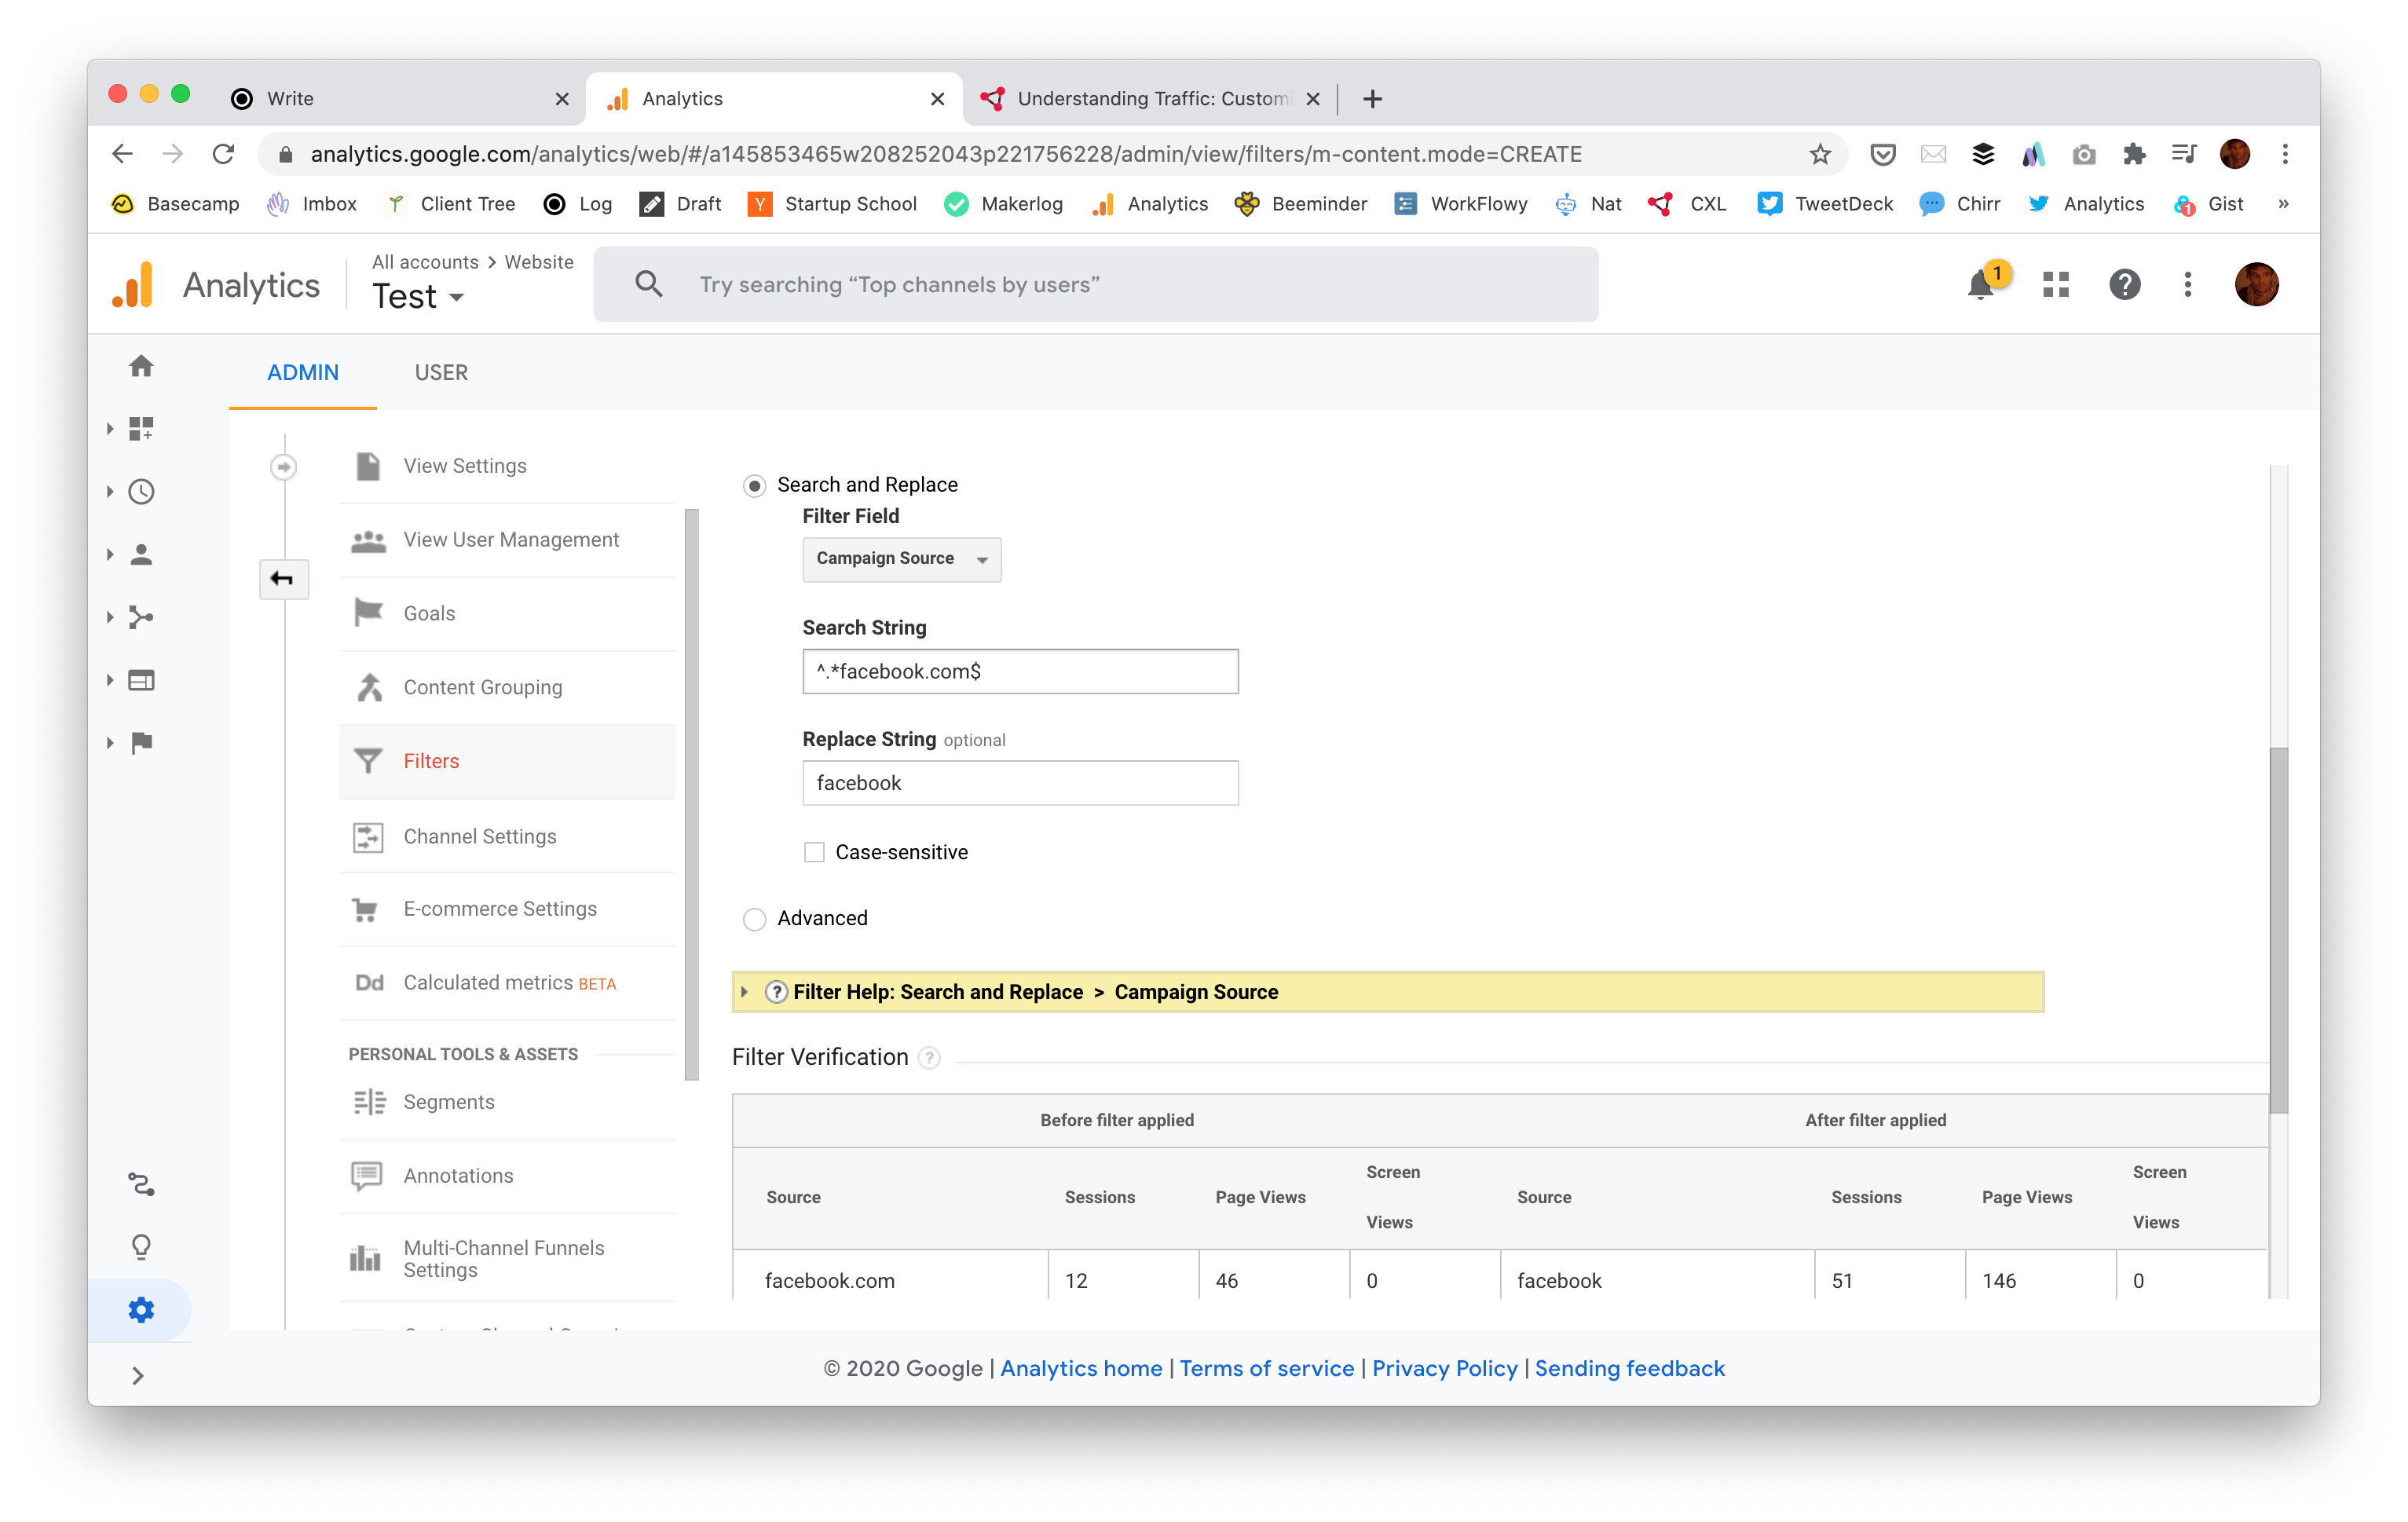
In the filter field you want you want to select campaign source, then in the search string you want to use regex to tell it to find any source that ends with facebook.com ^.*facebook.com$, and then in the replace string field you give it the new name you want it to use. I’ve linked to a neat guide on getting started with regex in the links in the footer.
Rather than having three different types of facebook traffic in my sources panel, now it will all just show up under a single facebook label. You can repeat these steps for any kind of fractured traffic by just replacing the domain name in the example above.
The next thing I did was create a UTM parameter for the links I share in facebook groups so that I can distinguish it from when I share stuff with my friends on facebook. This is why some facebook traffic has started showing up as facebook-groups in the screenshot above.
The last thing we need to clean this up is a referral exclusion list. You can do this by going to the property settings. I’ve highlighted the button in red on the screenshot below.
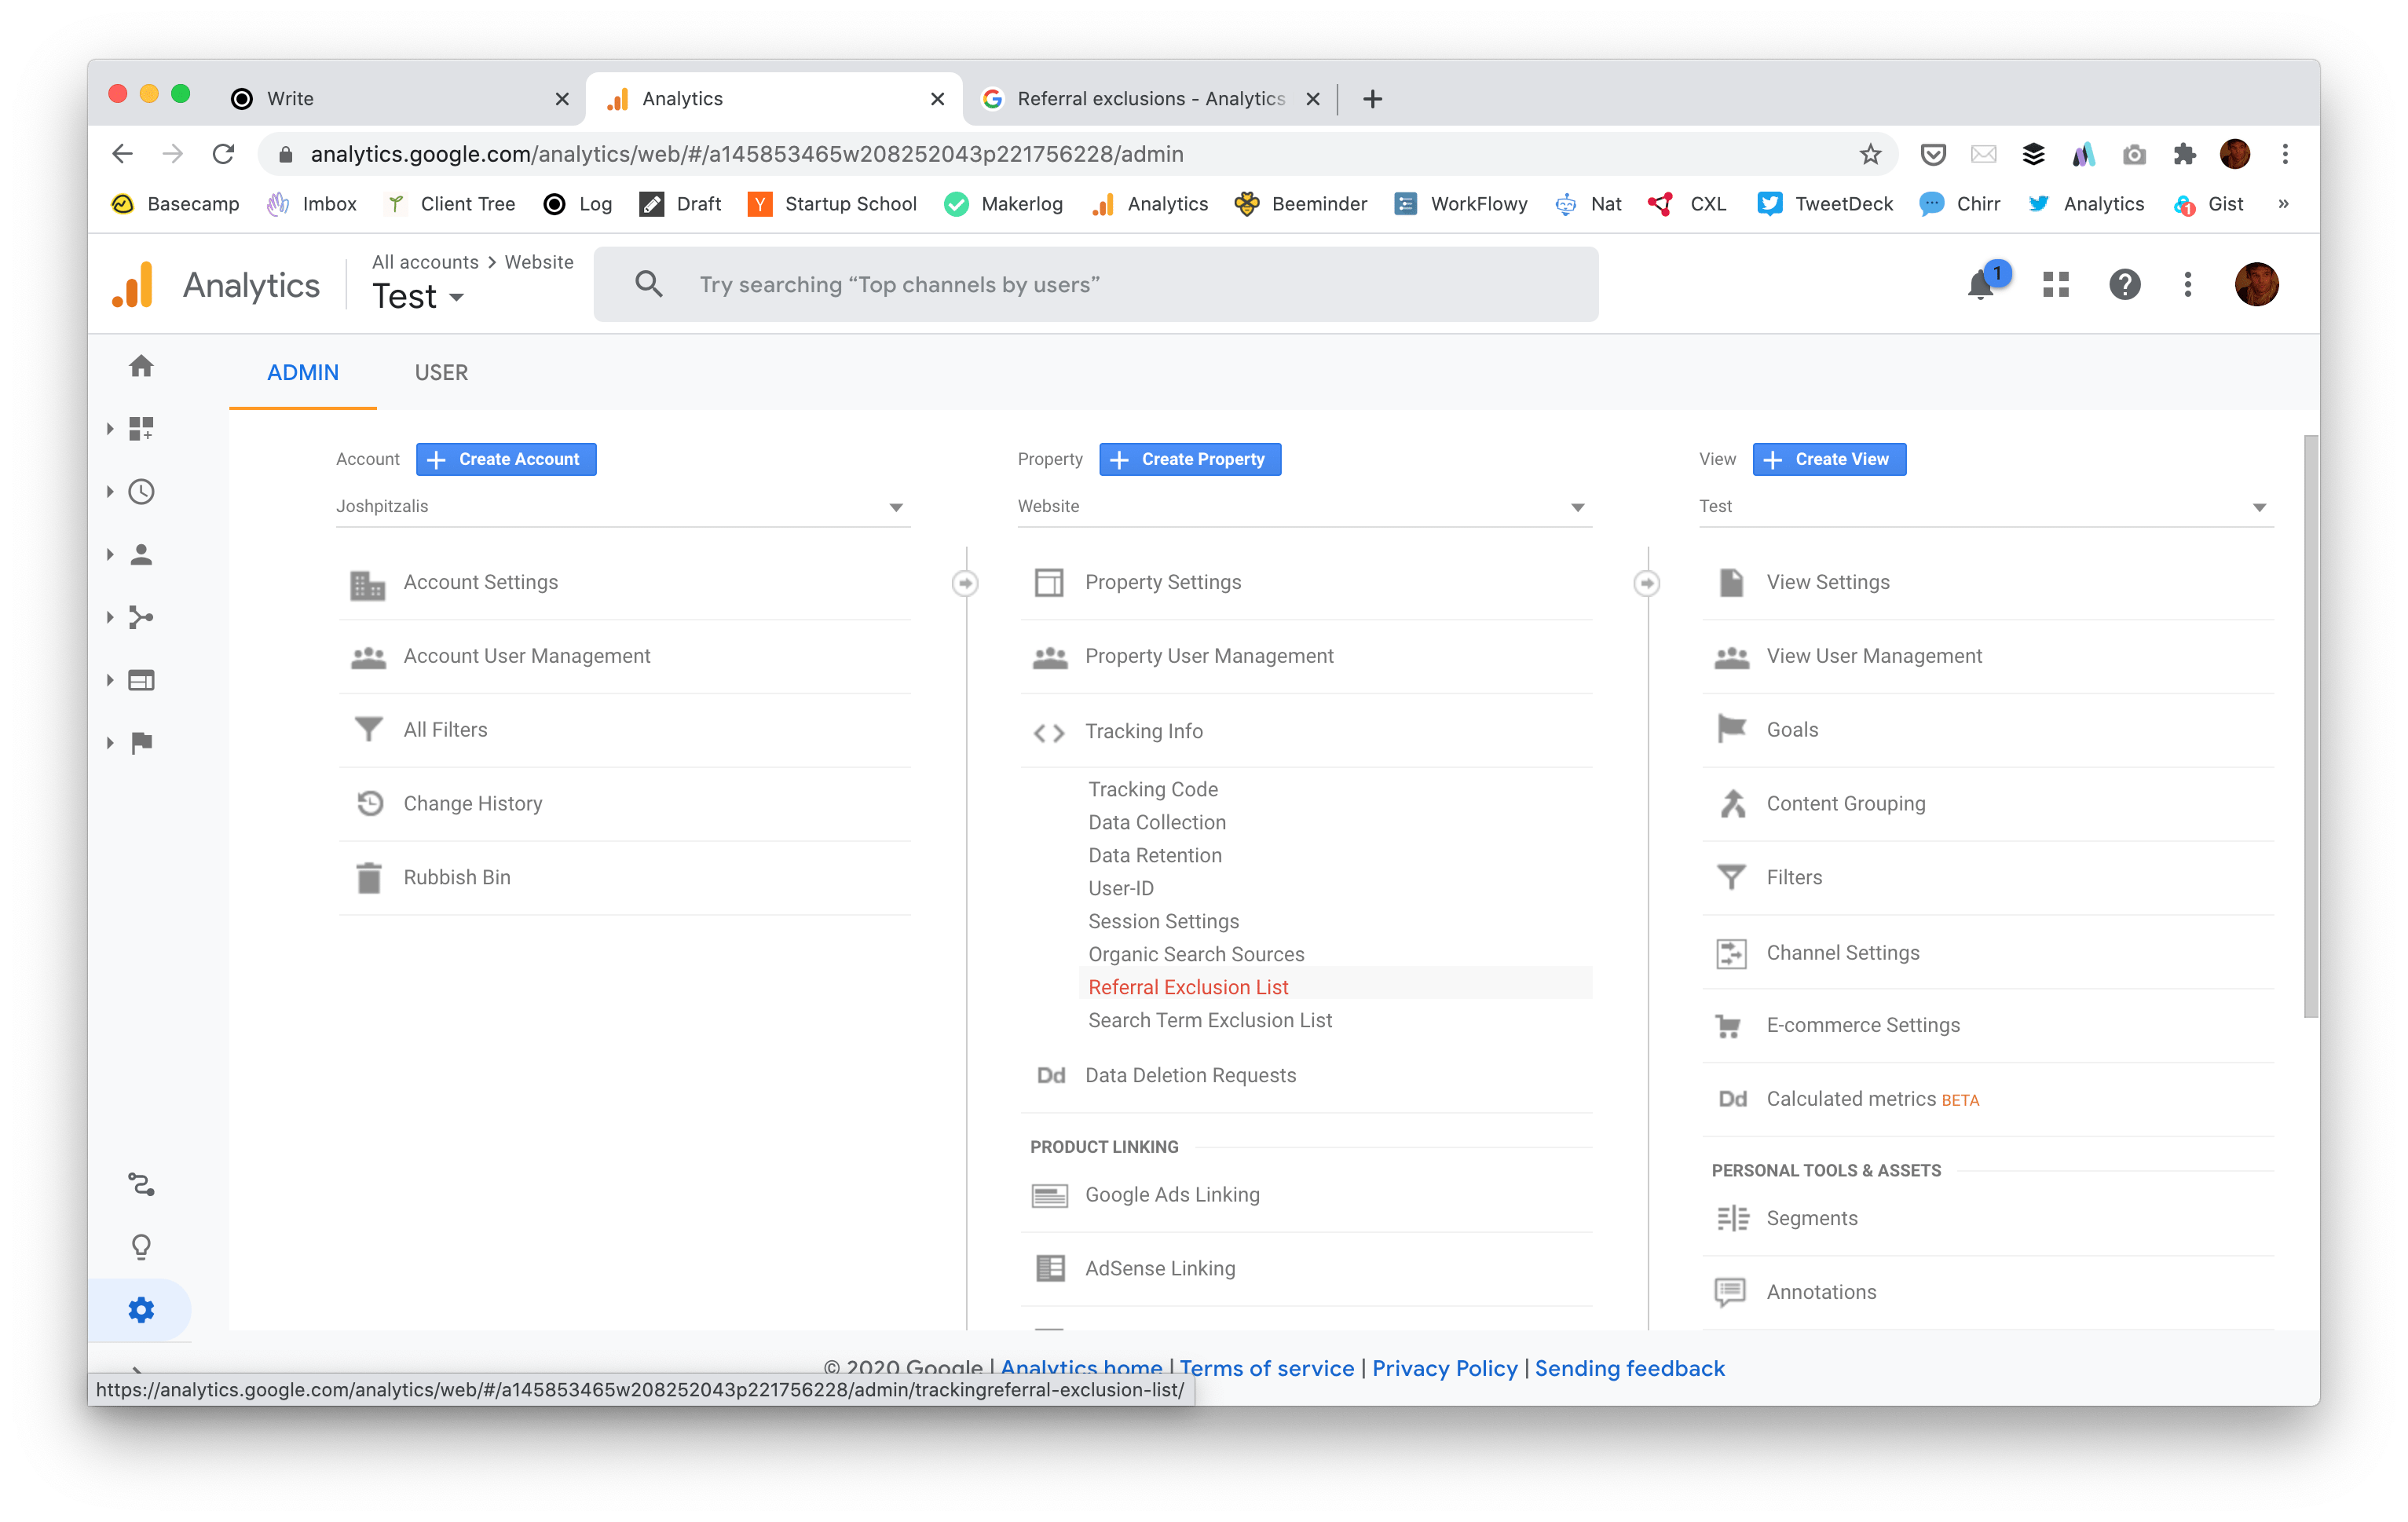
Referral exclusion means removing your own domains from your traffic. I have sources like joshpitzalis and learninglog showing up in my traffic. These are both my own sites. To prevent this from continuing to happen I’ve added both of these domains to the referral exclusion list.
Unfortunately, none of these changes will apply in retrospect so it’s important to make these changes as soon as you can. Now that the measures are in place, cleaner traffic will slowly drown out the messiness.
Now we know how much traffic we’re getting, where it’s coming from and how it gets broken down. The next piece of the puzzle is to figure out which source of traffic is having the biggest impact to your business.
Tracking How Well Your Traffic Converts#
A conversion is just a measurement of how many people do something. If 1000 people visit your website and 20 of them sign up to your mailing list then your mailing list’s conversion rate is 2% (20/1000 X 100).
Before you can track any kind of conversion you have to figure out what it is you want people to do. In the example above we want people to sign up to our mailing list. For most Saas businesses the goal of the landing page is to get people to sign up.
You are allowed to track 20 goals in google analytics. To keep things simple I recommend just starting with your single most important goal.
To set up a goal in Analytics you must go to the admin section, and then click on the goals in the view column, and then click on the red ‘create goal’ button. This will take you to the following page:
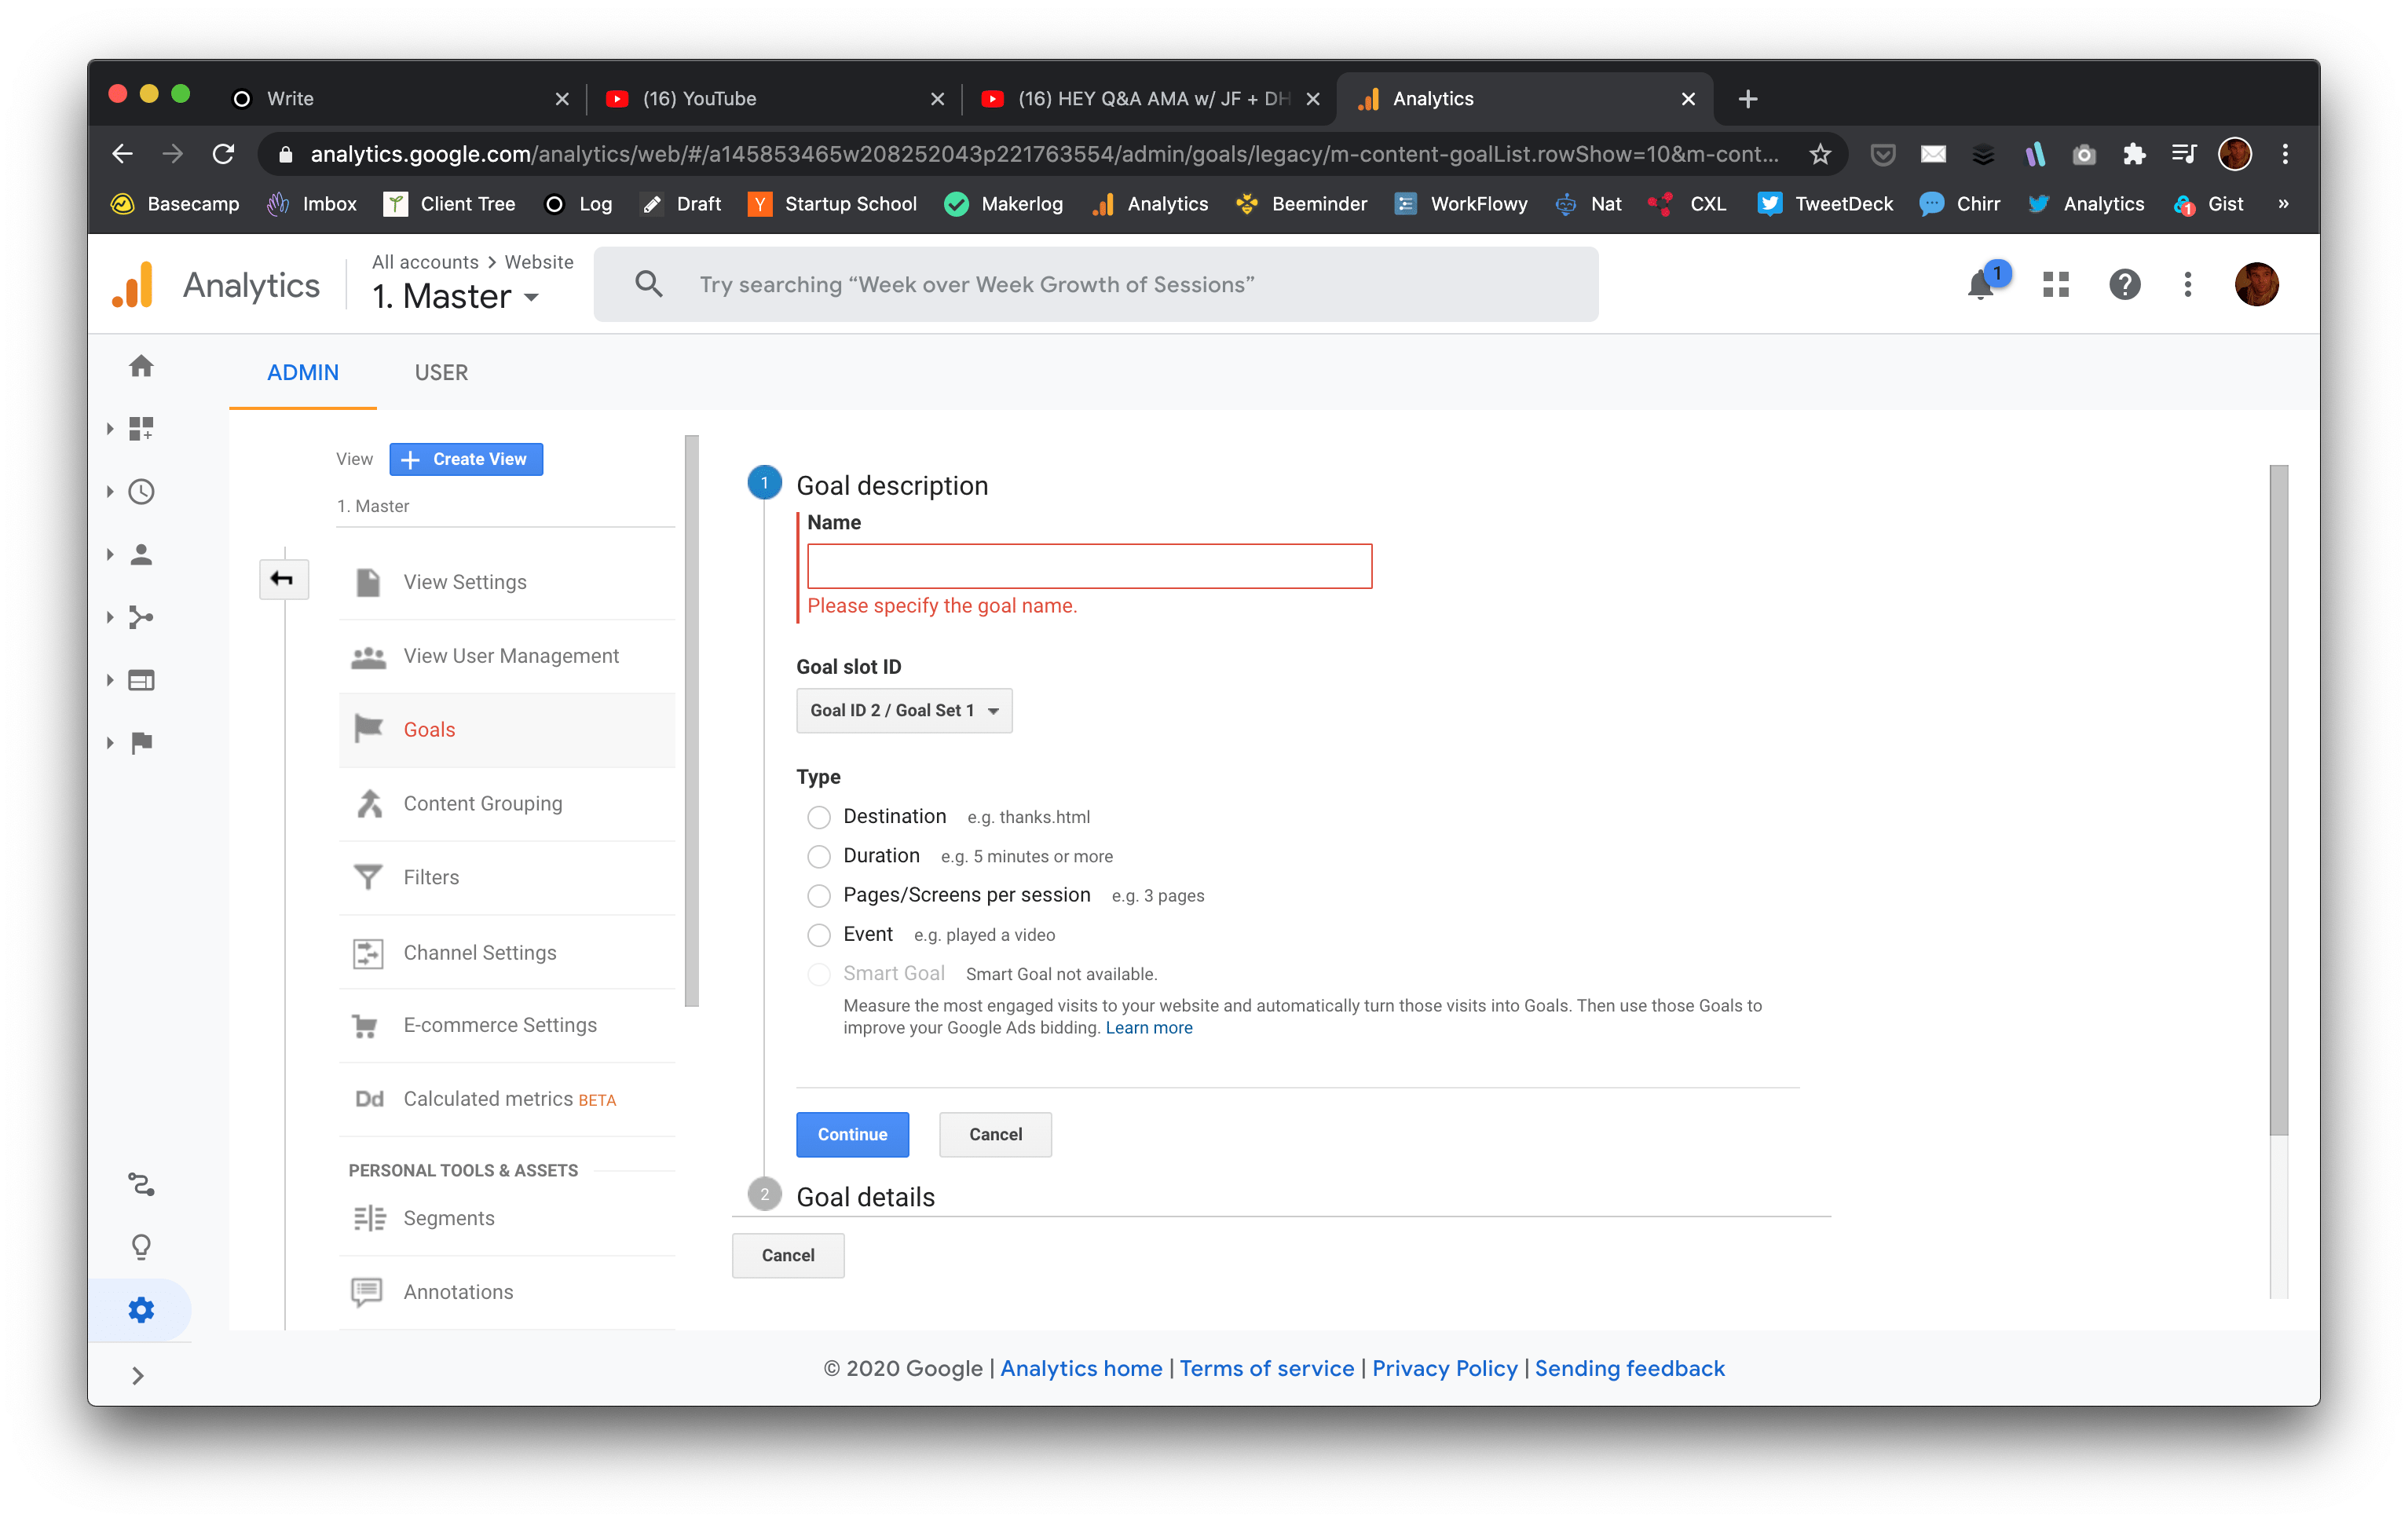
If you want to track people filling out a registration form then you will need to set up an event goal so that you can track the registration form submission event. You will need to go into the form in your landing page source code and trigger the event on submit. Depending on how you have analytics setup, you will need to do this with Google Tag Manager or the Google Analytics event trigger (or however else your project tracks events).
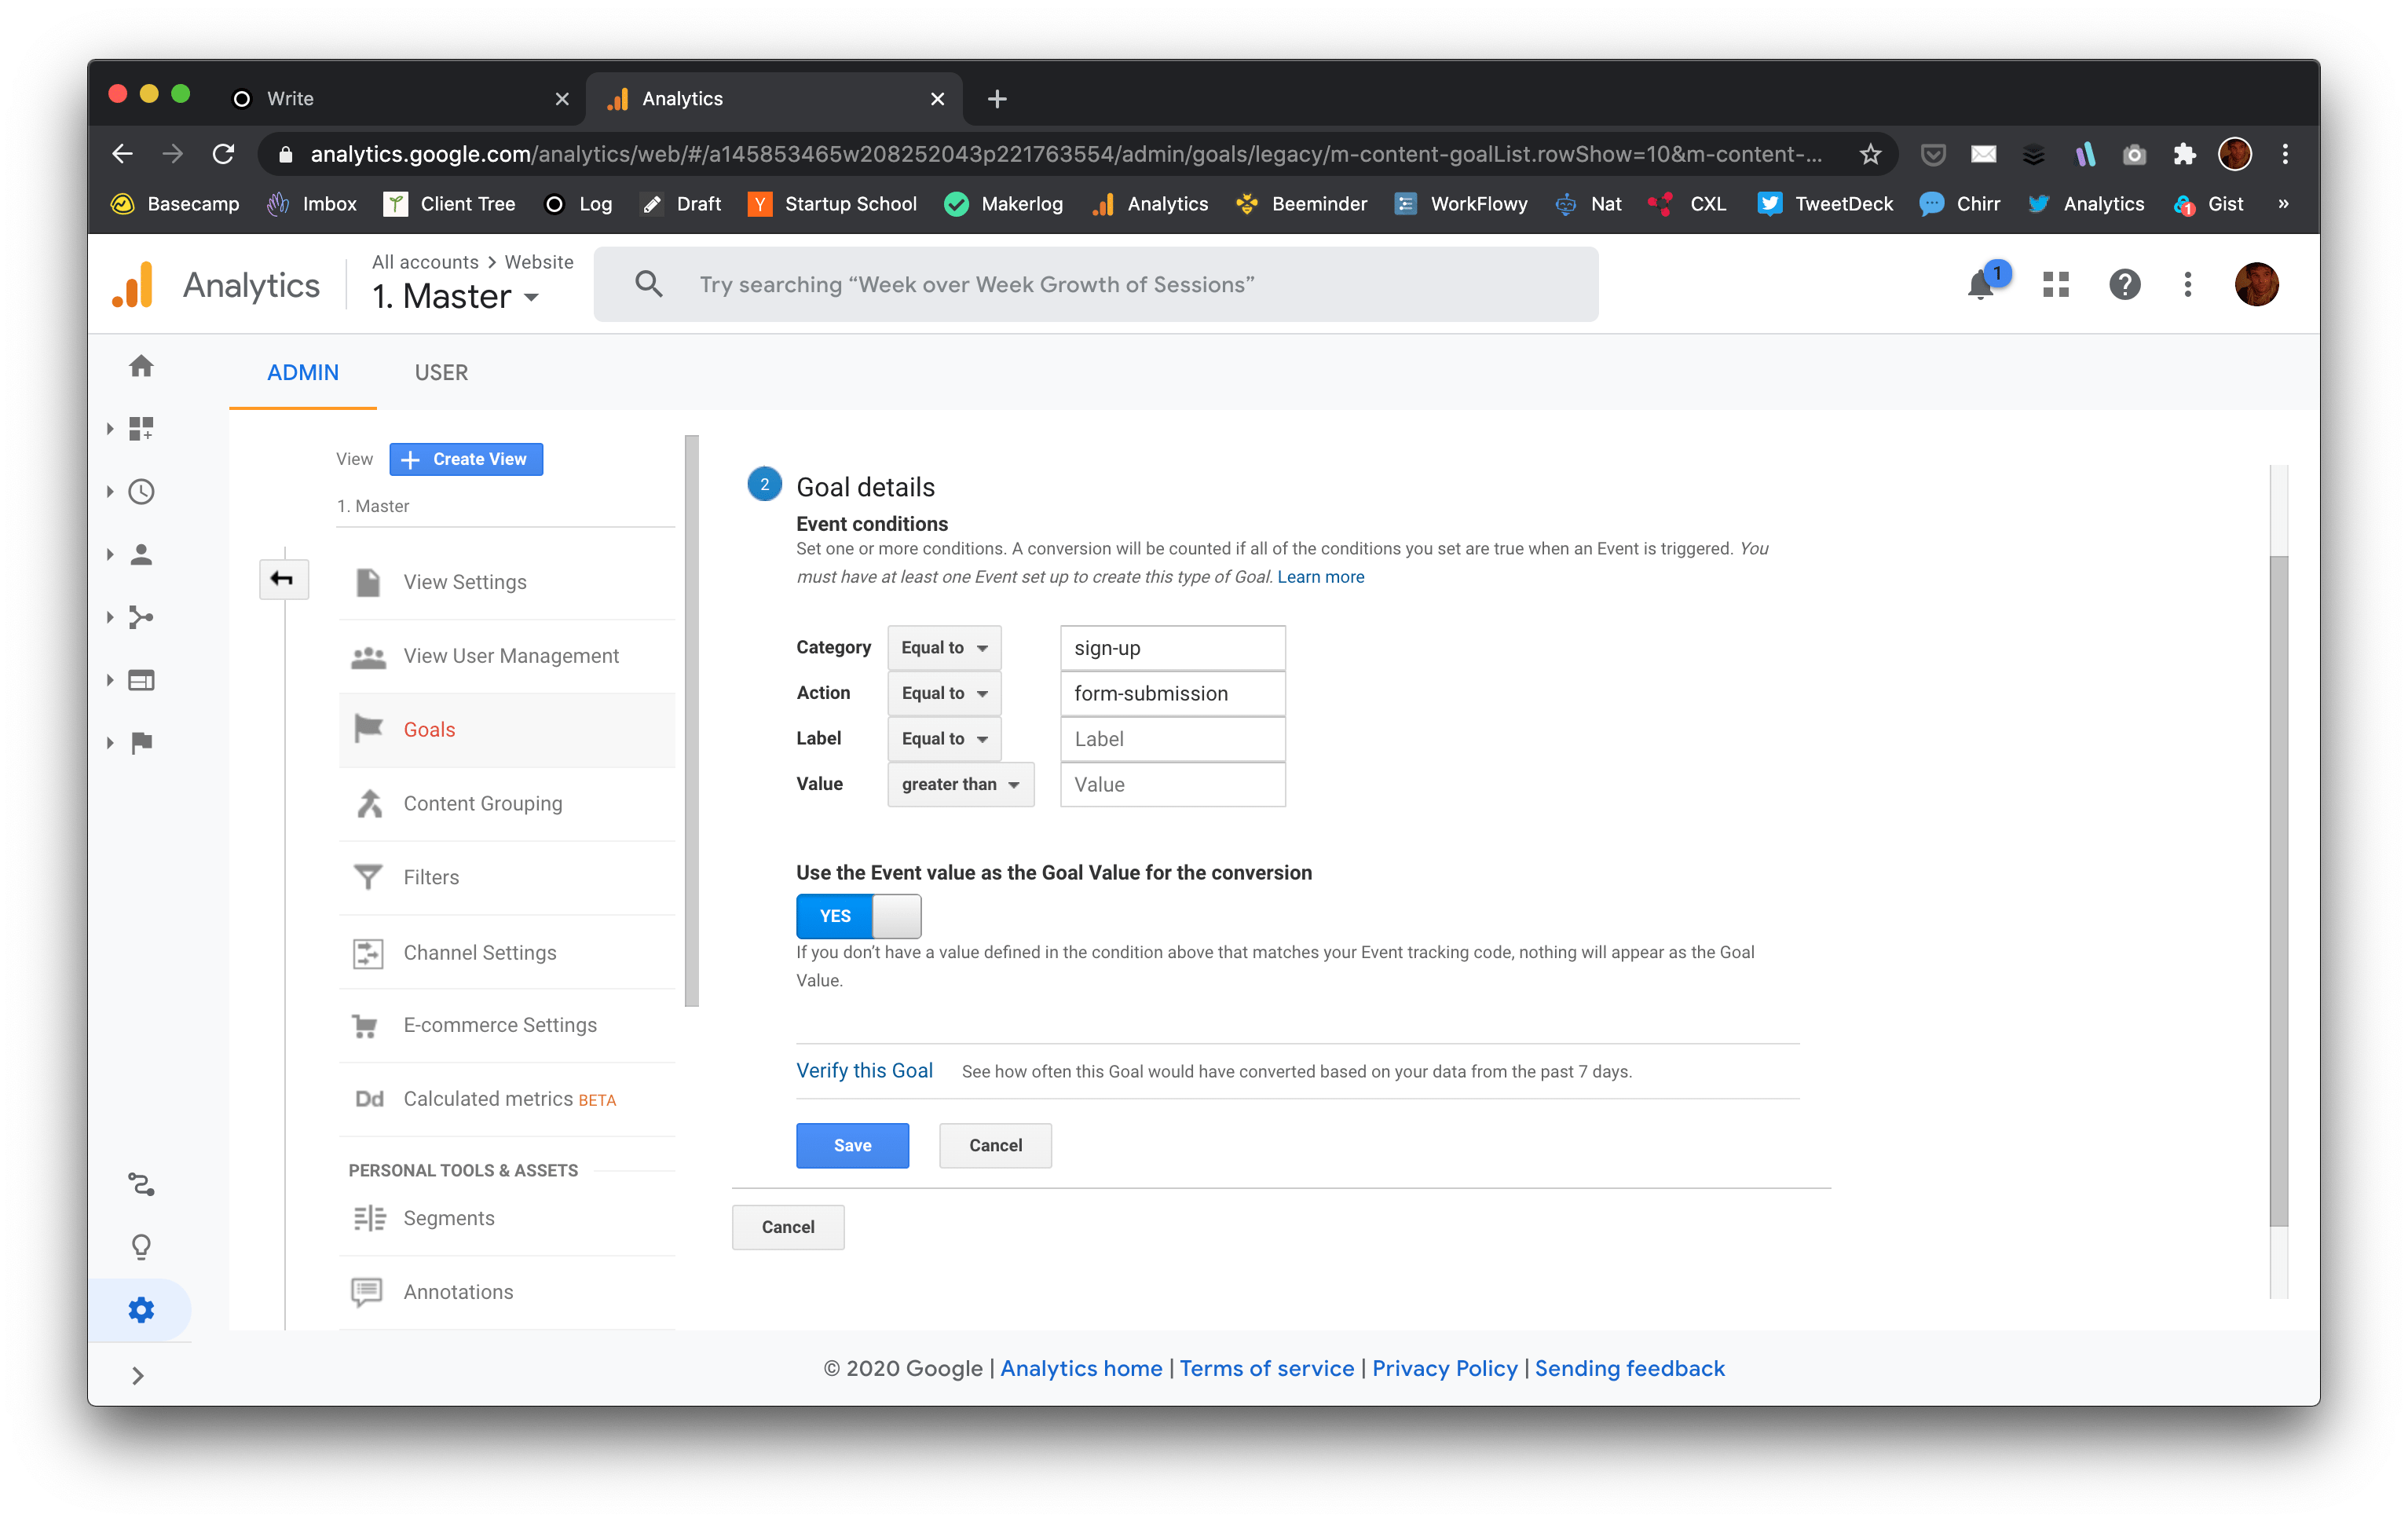
When you fire the event you will need to define an event category and an event action. The category is the broad grouping of the event; so ‘sign-up’ or ‘registration’ or something like that. The action is the specific behaviour you are tracking, for example ‘form submission’. Labels and values are optional. If you have multiple signup forms you can use a label to add info about which form fired the event. If the signup is paid you can also allocate a dollar value to the action. These last two are optional.
That was a bit complicated but you must set up a goal in order to track your conversion rate. If event goals sound too complicated, then a simpler alternative is to set up a destination goal. This tracks when people land on a specific page. To do this you must create a page that people can only reach after completing your goal. You simply add the url of the destination page to the goal and you are done. This is often why people direct you to a thank you page when you download something online. You could also have a welcome page that people only visit once after they sign up. However, you must make sure people don’t see the welcome page every time they login otherwise it will skew your metrics. This is why, for signups, event goals make more sense. There are two other types of goals but those are more suited for blogs and content focused websites so I won’t go into those.
Once you have set up your goal, the source/medium page from before will have a whole new section appended to the end of it called Conversion. In this case, my goal for my website is to get people to book in an initial conversation.
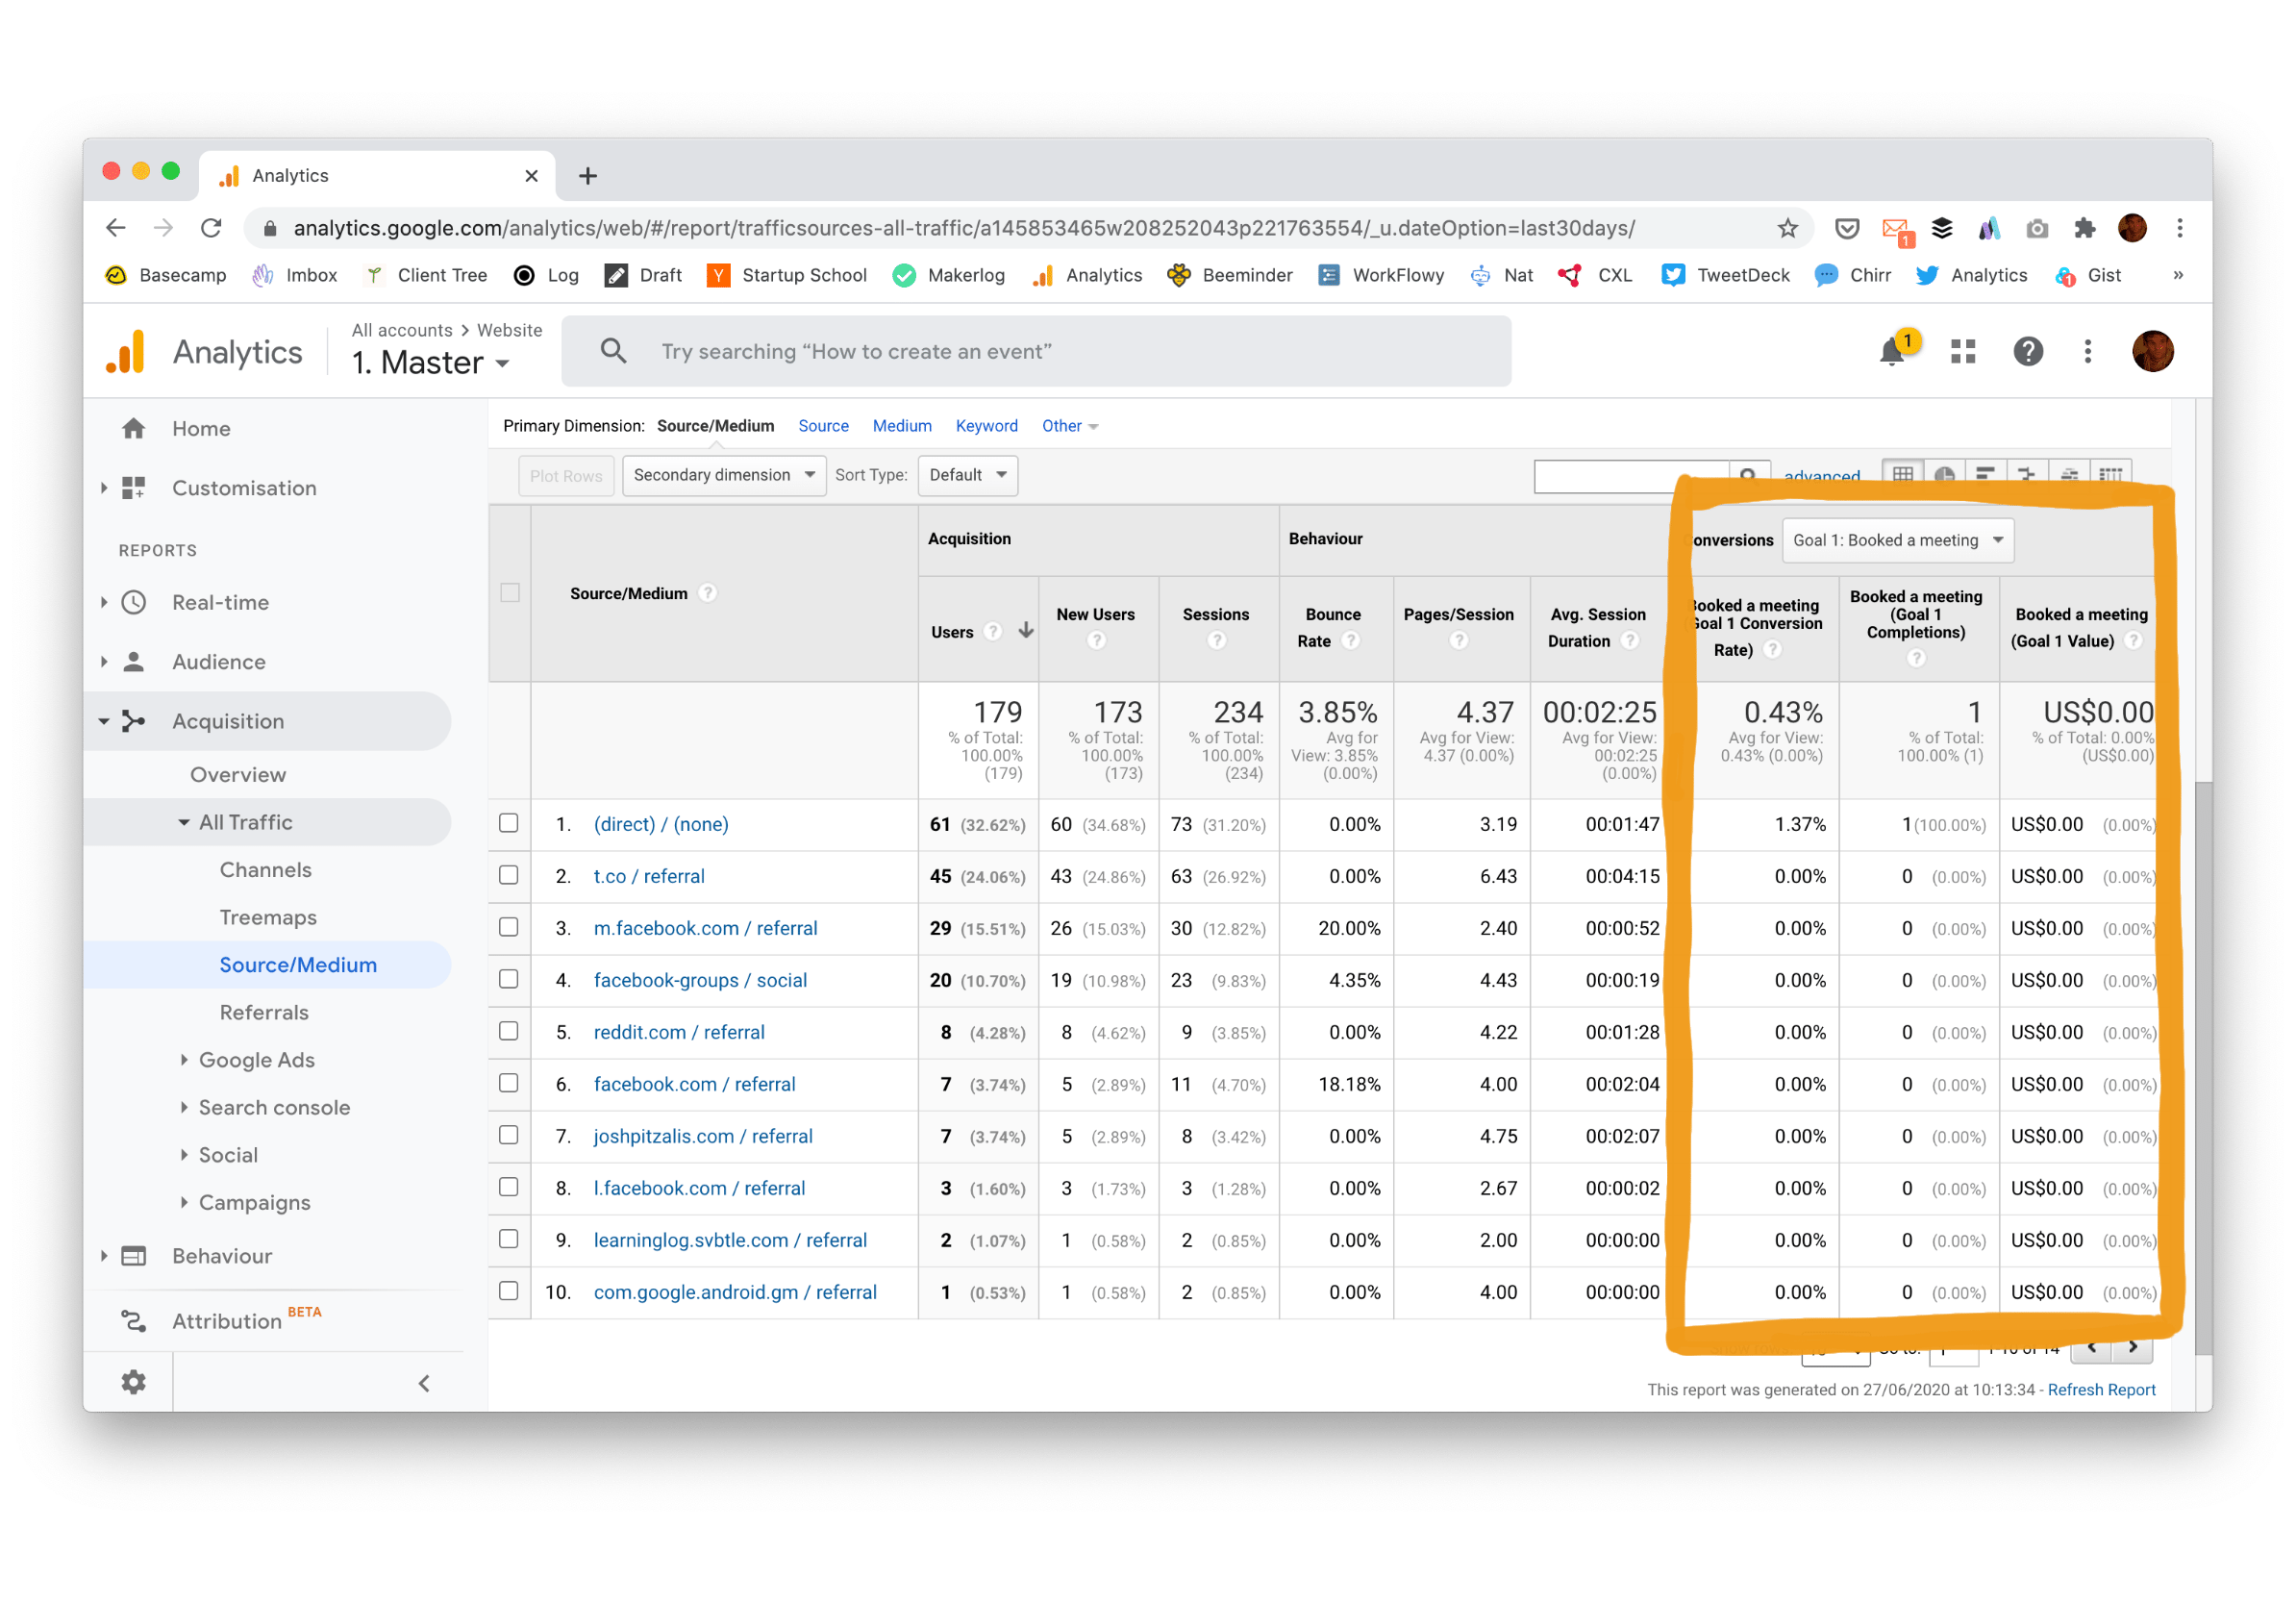
This page now has three groups of column, acquisition, behaviour and conversion ( I have outlined the conversion column in orange above).
The acquisition column tells you how much traffic is coming from each of your sources. This is what almost everyone uses Analytics for.
The behaviour column tells you how engaged a source of traffic is. There are three sub columns, you have the bounce rate (the percentage of people that view a page once, do nothing else and then leave), pages per session and the average session duration. These three columns help me assess the quality of my traffic.
If I just looked at the acquisition column (and tally up all my fractured facebook sources) I would see that I am getting most of my amount of traffic from Facebook. However, if you look at the behaviour column you can see that my Facebook traffic has a much higher bounce rate than anything else. It also shows me that people who come from Twitter spend a lot longer on the site and view more pages per visit. So thanks to the behaviour columns I can tell that Facebook might be giving me more traffic, but Twitter is clearly giving me better traffic.
The final column is Conversion, this shows you the result of all this traffic and engagement. In the screenshot above we can see that one person booked a consultation with me (this is the goal I have set up on my website). Unfortunately this person came from the direct medium so analytics can’t tell me how this person found my website. Had I started using UTM links sooner I’d see what source of traffic this conversion came from. As more conversions start coming in with cleaner traffic data I will be able to tell where my highest converting traffic is coming from.
There are lots of other things you can do with the conversion section. You can set up multiple goals, you can have multi channel goals, you can even set up neat visualisations to see where people drop out of your sales funnel but I don’t recommend diving into all that until you need to. Trying to learn analytics in its entirety is a waste of time. A much better approach is to ask an important question, and then just learn enough to answer that question. A good baseline is to understand how much traffic you get, where it is coming from and how well it is converting. Now you know how to answer all three of those questions.
Links Mentioned#
- This is the super cool book on regex for analytics.
- Here is the UTM tracker I use.
- If you’d like to read more posts about conversion optimisation you can follow me on twitter @joshpitzalis.
- This is post 3 in a series. The rest of the posts are listed here.
- This is the CXL Institute’s conversion rate optimisation program I am currently doing.
