Six weeks ago I got accepted to CXL institutes’ conversion optimisation mini-degree scholarship. It claims to be one of the most thorough conversion rate optimisation training programs in the world. The program runs online and covers 74 hours and 37h minutes of content over 12 weeks. As part of the scholarship, I have to write an essay about what I learn each week. This is my sixth report.

A/B testing for conversion rate optimization only makes sense if you have at least 1000 transactions a month. I realise this may be a bold statement for some, especially if you’re new to A/B testing, so I’m going to back that up and unpack my argument in this post.
First, a transaction doesn’t have to be a commercial transaction. It could be a sale, it can also be a signup or a download, or a phone call: it can be anything you want to optimise. If you want to optimise for signups, you need about 1000 signups a month before you start A/B testing. Any less than that and it makes more sense to invest your time and energy into growth instead. You could invest in ads, you can do a giveaway, you can change your site up, you can still make all the changes, you just won’t have the reassurance of test data to fallback on.
With less than a thousand transactions it will either take too long to get results or the results will be too unreliable to work with.
If any of this gets too confusing, just think about it in terms of a coronavirus test. If a test takes 24 months, it’s not going to be a very useful test. On the other hand, if you get a result right away but you can’t trust what it tell you then there is little point in doing the test.
A thousand transactions a month is a rule of thumb for doing reliable AB tests that you can complete in a practical timeframe. The reality is always more complicated. Now I will show you how to workout exactly how long you need to run your test for, and what happens if you stop it early.
How Long To Run The Test For#
I will not share any mathematical formulas in this post. Instead I have gone out and tried to find the simplest sample size calculator I could. The one I have landed on is Vlad Malik’s Reverse Sample Size Calculator (there is a link to it in the footer).

There are only two inputs:
- Your current conversion rate
- How much traffic you currently have
Plug them in and it tells you how much traffic you need to run a reliable test and how long you need to run it for.
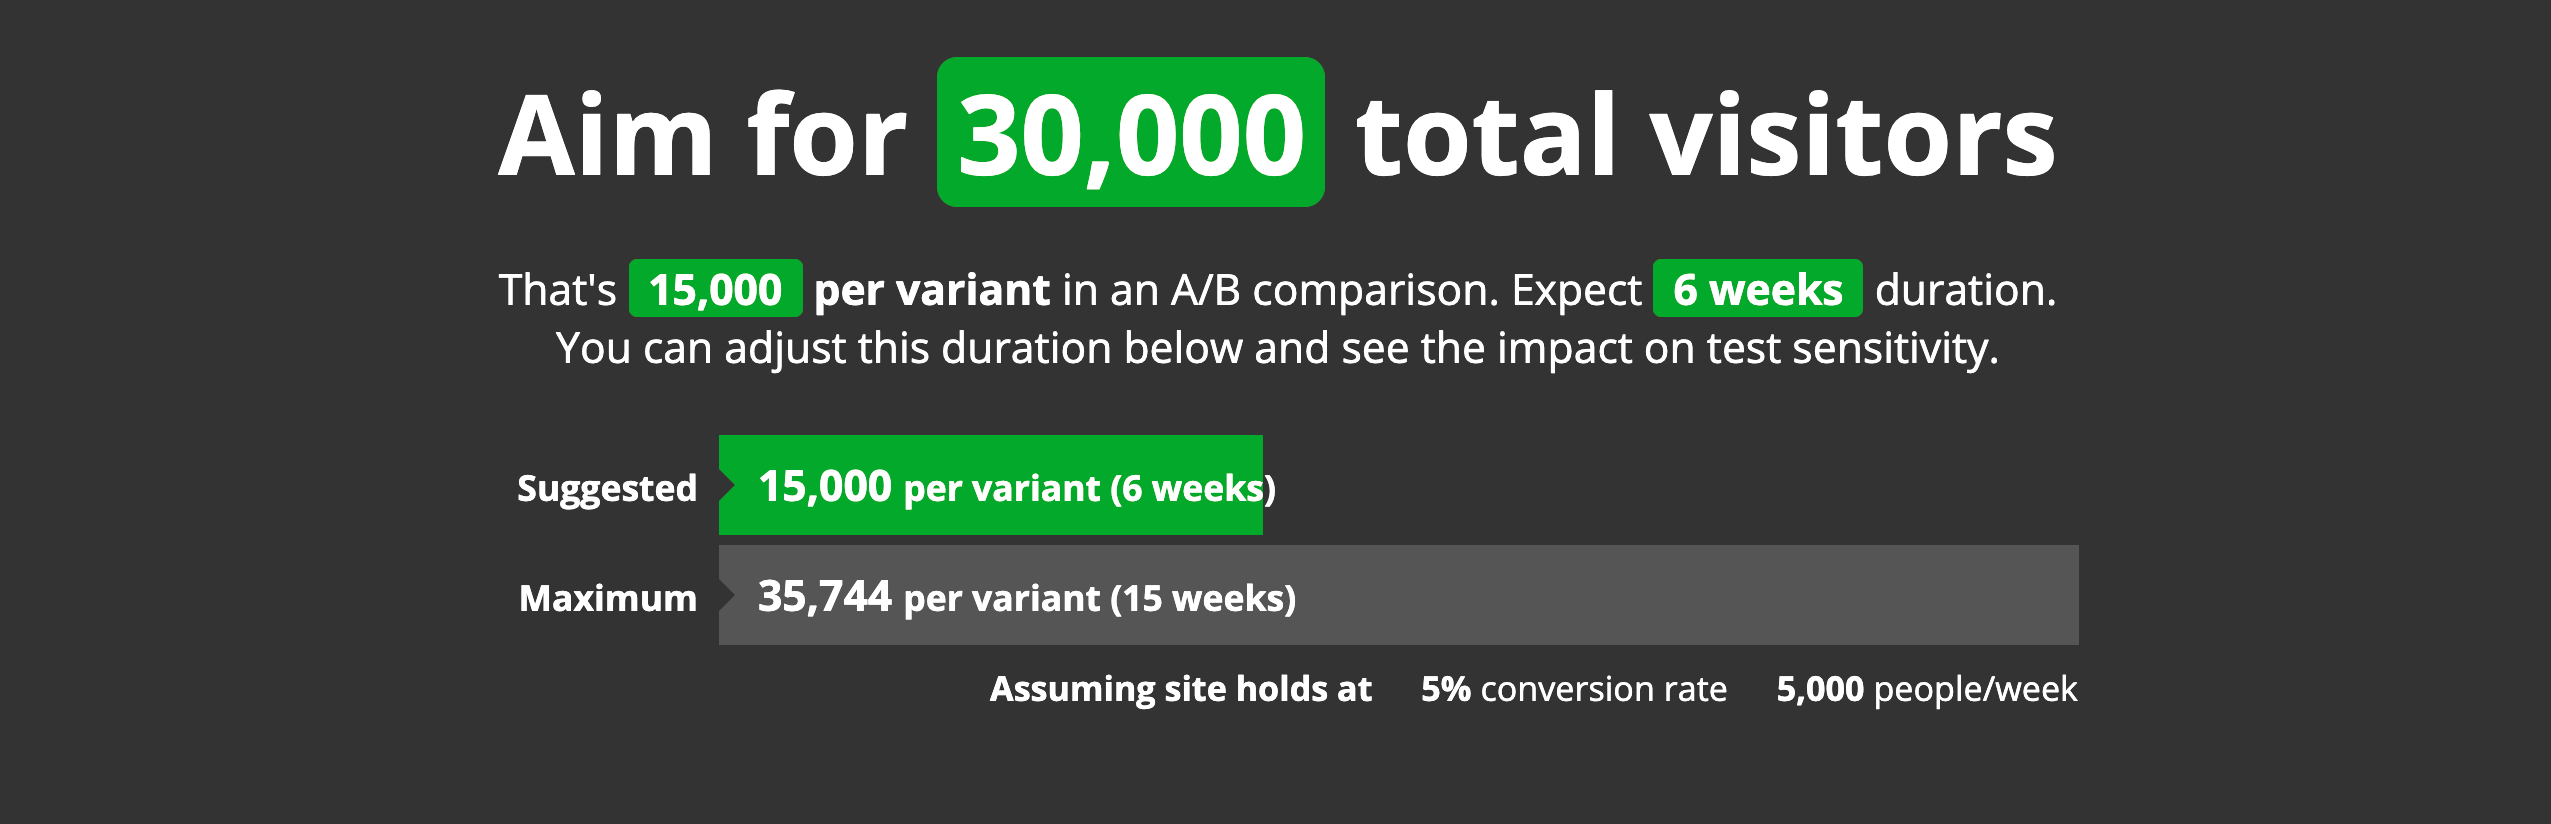
I like this calculator because it doesn’t ask you for the size of the improvement you want to detect. Most other calculator do. If I am calculating how long I need to run an AB test for then I don’t know the effect size, which is why I am running the test. The reverse calculator avoids the need for this input by giving you back a range of effects sizes and explaining the tradeoffs between them.

This part is less intuitive. Let me help you understand what is going on here. The percentages on the left denote the size of the effect you can detect. I’m referring to the 16% on the left in the first row. This means that if your original website makes 100 conversions, the variation would need to make 116 conversions for us to be able to say that the second variation is an improvement over the original.
In the second row the effect is 14%. The tradeoff here is power. Statistical power is the test’s ability to detect an effect when one actually exists. In the first row the power is 90%. This means that if you run this test 20 times, it will detect the effect 18 times out of 20 (thats 90%). In the second row it will only detect the effect 16 times. That means 4 of the times you run the test, it will tell you there is no measurable difference (despite one actually existing). This is called a false negative. The test shows a negative result, but that result is false (because in reality an effect does exist).
Coming back briefly to our coronavirus analogy. You do the test, it says negative but you actually do have the virus. This is a false negative. Very dangerous. High statistical power means less false negatives.
The convention is to set statistical power at 80%. The statistics community have decided that 4 false negatives for every 20 tests is good enough to work with. If you take a look, the opacity on the second row is slightly higher to denote this convention.
The next thing you have to watch out for are false positives. This is when you don’t have the virus, but the test says you do. Also very dangerous. In an A/B testing scenario you will implement changes thinking that it will lead to an improvement, but in reality there will be no improvement, it might even get worse.
If statistical power is the ability to detect an effect when there is one, then statistical significance is how often you detect an effect when there isn’t one.
The reverse calculator sets the false positive risk at 5%. That means that if you run the test 20 times, one of those times a positive result could be because of pure chance. In reality there is no positive result. Again, this threshold is a decision that the statistical community has arrived at. 95% confidence is generally accepted to be good enough to work with.
The longer you leave a test running the less chance there is of a false positive. An easy mistake to make is to end a test as soon as you see the test reach 95% confidence.
What Happens If You Stop Early#
If you stop your test as soon as you see a “significant” difference, you probably haven’t achieved the outcome you think you have.
Imagine you have two dice and you want to check if one is weighted. You roll both dice 10 times. One die seems to be random, the other lands on 3 for more than half of the rolls.
If you check for significance, you’ll get what looks like a statistically significant result. Stop now and you will think one die is heavily weighted. This is how ending a test early can lead to a significant, but inaccurate, result.
The reality is that 10 rolls is just not enough data for a meaningful conclusion. The chance of false positives is too high with such a small sample size. If you keep rolling, you will see that the dice are both balanced and there is no statistically significant difference between them.
The best way to avoid this problem is to decide on your sample size in advance and wait until the experiment is over before you start believing the results your A/B testing software gives you.
To summarize, let’s say you have a website that gets about 1000 hits of traffic a month. About 3% of the people who visit your website sign up to your mailing list. An industry leading competitor published a case study where adding emojis to their sign up button improved signups.
You want to try emojis out on your website. So you hire someone to set up two versions of your website, the original one, and then a new one with emojis. You A/B test the difference by driving half of your traffic to one site and half to the other. Then you wait to see how many people sign up to the mailing list in each version. After a week, 3 people have signed up through the original and 5 signed up through the emoji version. Clearly the new variation is an improvement, there is no need to continue testing, now you start driving 100% of the traffic to the new site.
Wrong.
Before you start your test you must calculate how long the test needs to run for before you can call it a success. You plug your data into the reverse calculator (3% conversion and 1000 hits a month) and it tells you that you need to run the test for 8 weeks.
8 weeks is too long for you so you adjust the duration to 4 weeks and it shows you that you need a 104% improvement at the end of 4 weeks for the results to be reliable. Maybe the emojis will help but your test just wasn’t powerful enough to detect the improvement, or maybe the result you got was due to chance. Any less than a 104% improvement and there is no assurance that the emojis will have the intended effect when you start driving all of your traffic to it.
104% is an unreasonably large improvement to expect from an A/B test. The real problem here is that if your website that gets 1000 hits a month and converts at 3% then you have 30 transactions a month. This is nowhere enough data to be A/B testing, you should be focusing on growth (not optimisation). The industry competitor you were trying to copy gets about 50 thousand hits a month and converts at 4%, that’s 2000 transactions a month. Testing emoji buttons makes sense for them, not for you.
You don’t have to use the reverse sample size calculator everytime you want to do an AB test, a good rule of thumb is to check whether you have 1000 of the things you want to optimise per month. If you don’t, then focus on growth, not optimisation.
Links#
- Vlad Malik’s magnificent reverse sample size calculator.
- If you’d like to read more posts about conversion optimisation you can follow me on twitter @joshpitzalis.
- This is post 6 in a series. The rest of the posts are listed here.
- This is the CXL Institute’s conversion rate optimisation program I am currently doing.
