I got accepted to CXL institutes’ conversion optimisation mini-degree scholarship. It claims to be one of the most thorough conversion rate optimisation training programs in the world. The program runs online and covers 74 hours and 37h minutes of content over 12 weeks. As part of the scholarship, I have to write an essay about what I learn each week. This is my tenth report.

In part one of this article, I had a look at what conversion rate optimisation is, I went over what kind of results you can expect from an optimisation program, a framework for thinking about conversion research and the different types of tests there are.
In this article, I will look at how to calculate your conversion rate, how long you need to run tests for, and ideas you can test to get started.
CALCULATING YOUR CURRENT CONVERSION RATE#
Before you can track any kind of conversion you have to figure out what it is you want people to do. News sites want people to read articles, Facebook wants you to spend as much time as humanly possible on their site, a lot of sites just want you to sign up to their mailing list. For most Saas businesses the goal of the landing page is to get people to sign up or start a free trial.
Google Analytics can help you measure how well you convert traffic coming to your website. If you want to measure how well people convert within your application, or through a mailing list campaign, there are better tools. I’m going to cover Google analytics is by far the most ubiquitous way to measure your traffic conversion analytics.
You are allowed to track 20 goals in Google Analytics. To keep things simple I recommend just starting with your single most important goal.
To set up a goal in Analytics you must go to the admin section, and then click on the goals in the view column, and then click on the red ‘create goal’ button. If you want to track people filling out a registration form then you will need to set up an event goal so that you can track the registration form submission event. You will need to go into the form in your landing page source code and trigger the event on submit. Depending on how you have analytics setup, you will need to do this with Google Tag Manager or the Google Analytics event trigger.
When you fire the event you will need to define an event category and an event action. The category is the broad grouping of the event, so ‘sign-up’ or ‘registration’ or something like that. The action is the specific behaviour you are tracking, for example ‘form submission’. Labels and values are optional. If you have multiple signup forms you can use a label to add info about which form fired the event. If the signup is paid you can also allocate a dollar value to the action. These last two are optional.
You must set up a goal in order to track your conversion rate. If event goals sound complicated, a simpler alternative is to set up a destination goal. This tracks when people land on a specific page. To do this you must create a page that people can only reach after completing your goal. You simply add the URL of the destination page to the goal and you are done. This is often why people direct you to a thank you page when you download something online.
You could also have a welcome page that people only visit once after they sign up. However, you must make sure people don’t see the welcome page every time they login otherwise it will skew your metrics. This is why, for signups, event goals make more sense. There are two other types of goals but those are more suited for blogs and content-focused websites so I won’t go into those.
Once you have set up your goal, the source/medium page from before will have a whole new section appended to the end of it called Conversion. This page now has three groups of column, acquisition, behaviour and conversion.
The acquisition column tells you how much traffic is coming from each of your sources. This is what almost everyone uses Analytics for.
The behaviour column tells you how engaged a source of traffic is. There are three sub-columns, you have the bounce rate (the percentage of people that view a page once, do nothing else and then leave), pages per session and the average session duration. These three columns help me assess the quality of my traffic. The final column is Conversion, this shows you the result of all this traffic and engagement.
There are lots of other things you can do with the conversion section. You can set up multiple goals, you can have multi-channel goals, you can even set up neat visualisations to see where people drop out of your sales funnel but I don’t recommend diving into all that until you need to.
IMPLEMENTING YOUR TEST#
If you are measuring traffic to your website with Google Analytics then you can use another product called Google Optimise to run AB tests. Google optimise involves creating an account to get started. Once you are set up, you can create your first optimisation experience.
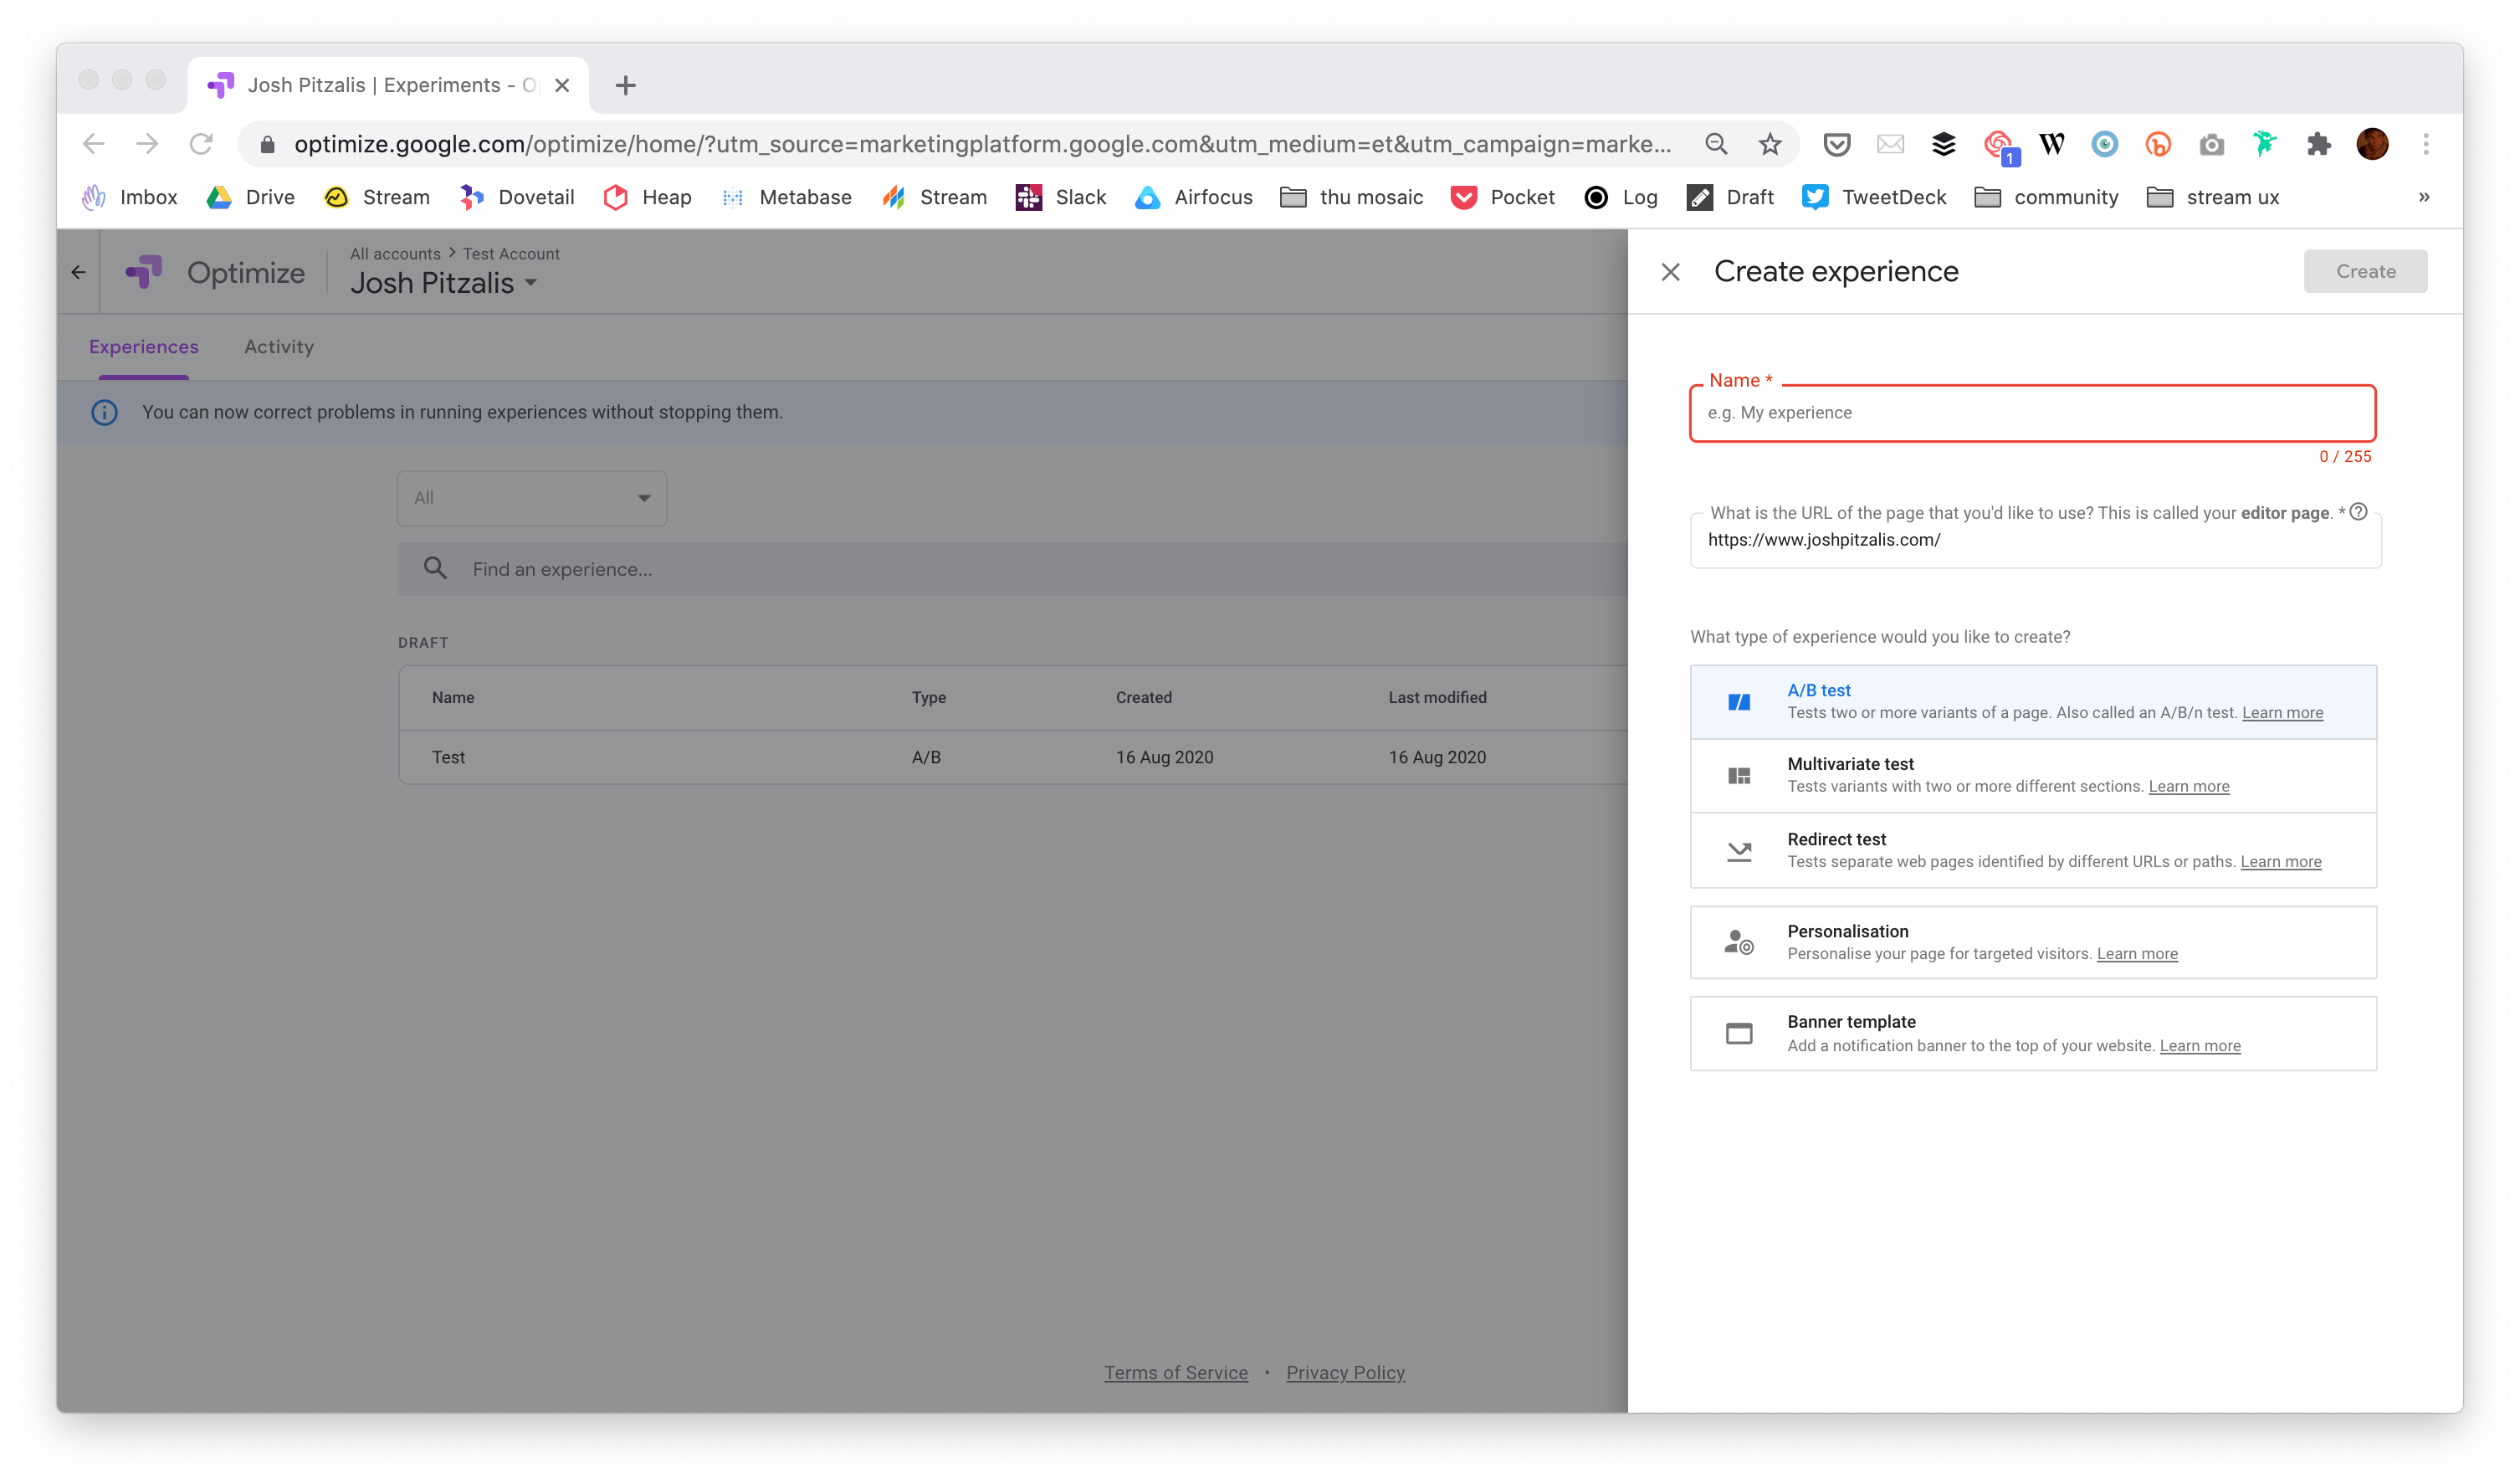
You give the test a name, add the URL to the website you want to test and pick the type of test you want to do. Your options are an AB test, a multivariate test, or a split test (I have added a link to part 1 of this article in the footer that explains the difference between these).
Setting up a test involves adding at least one variant. A variant is just a version of your website with some changes applied to it. If you want to test a version of your website with green text and another with red text then you would set up one green text variant and another red text variant.
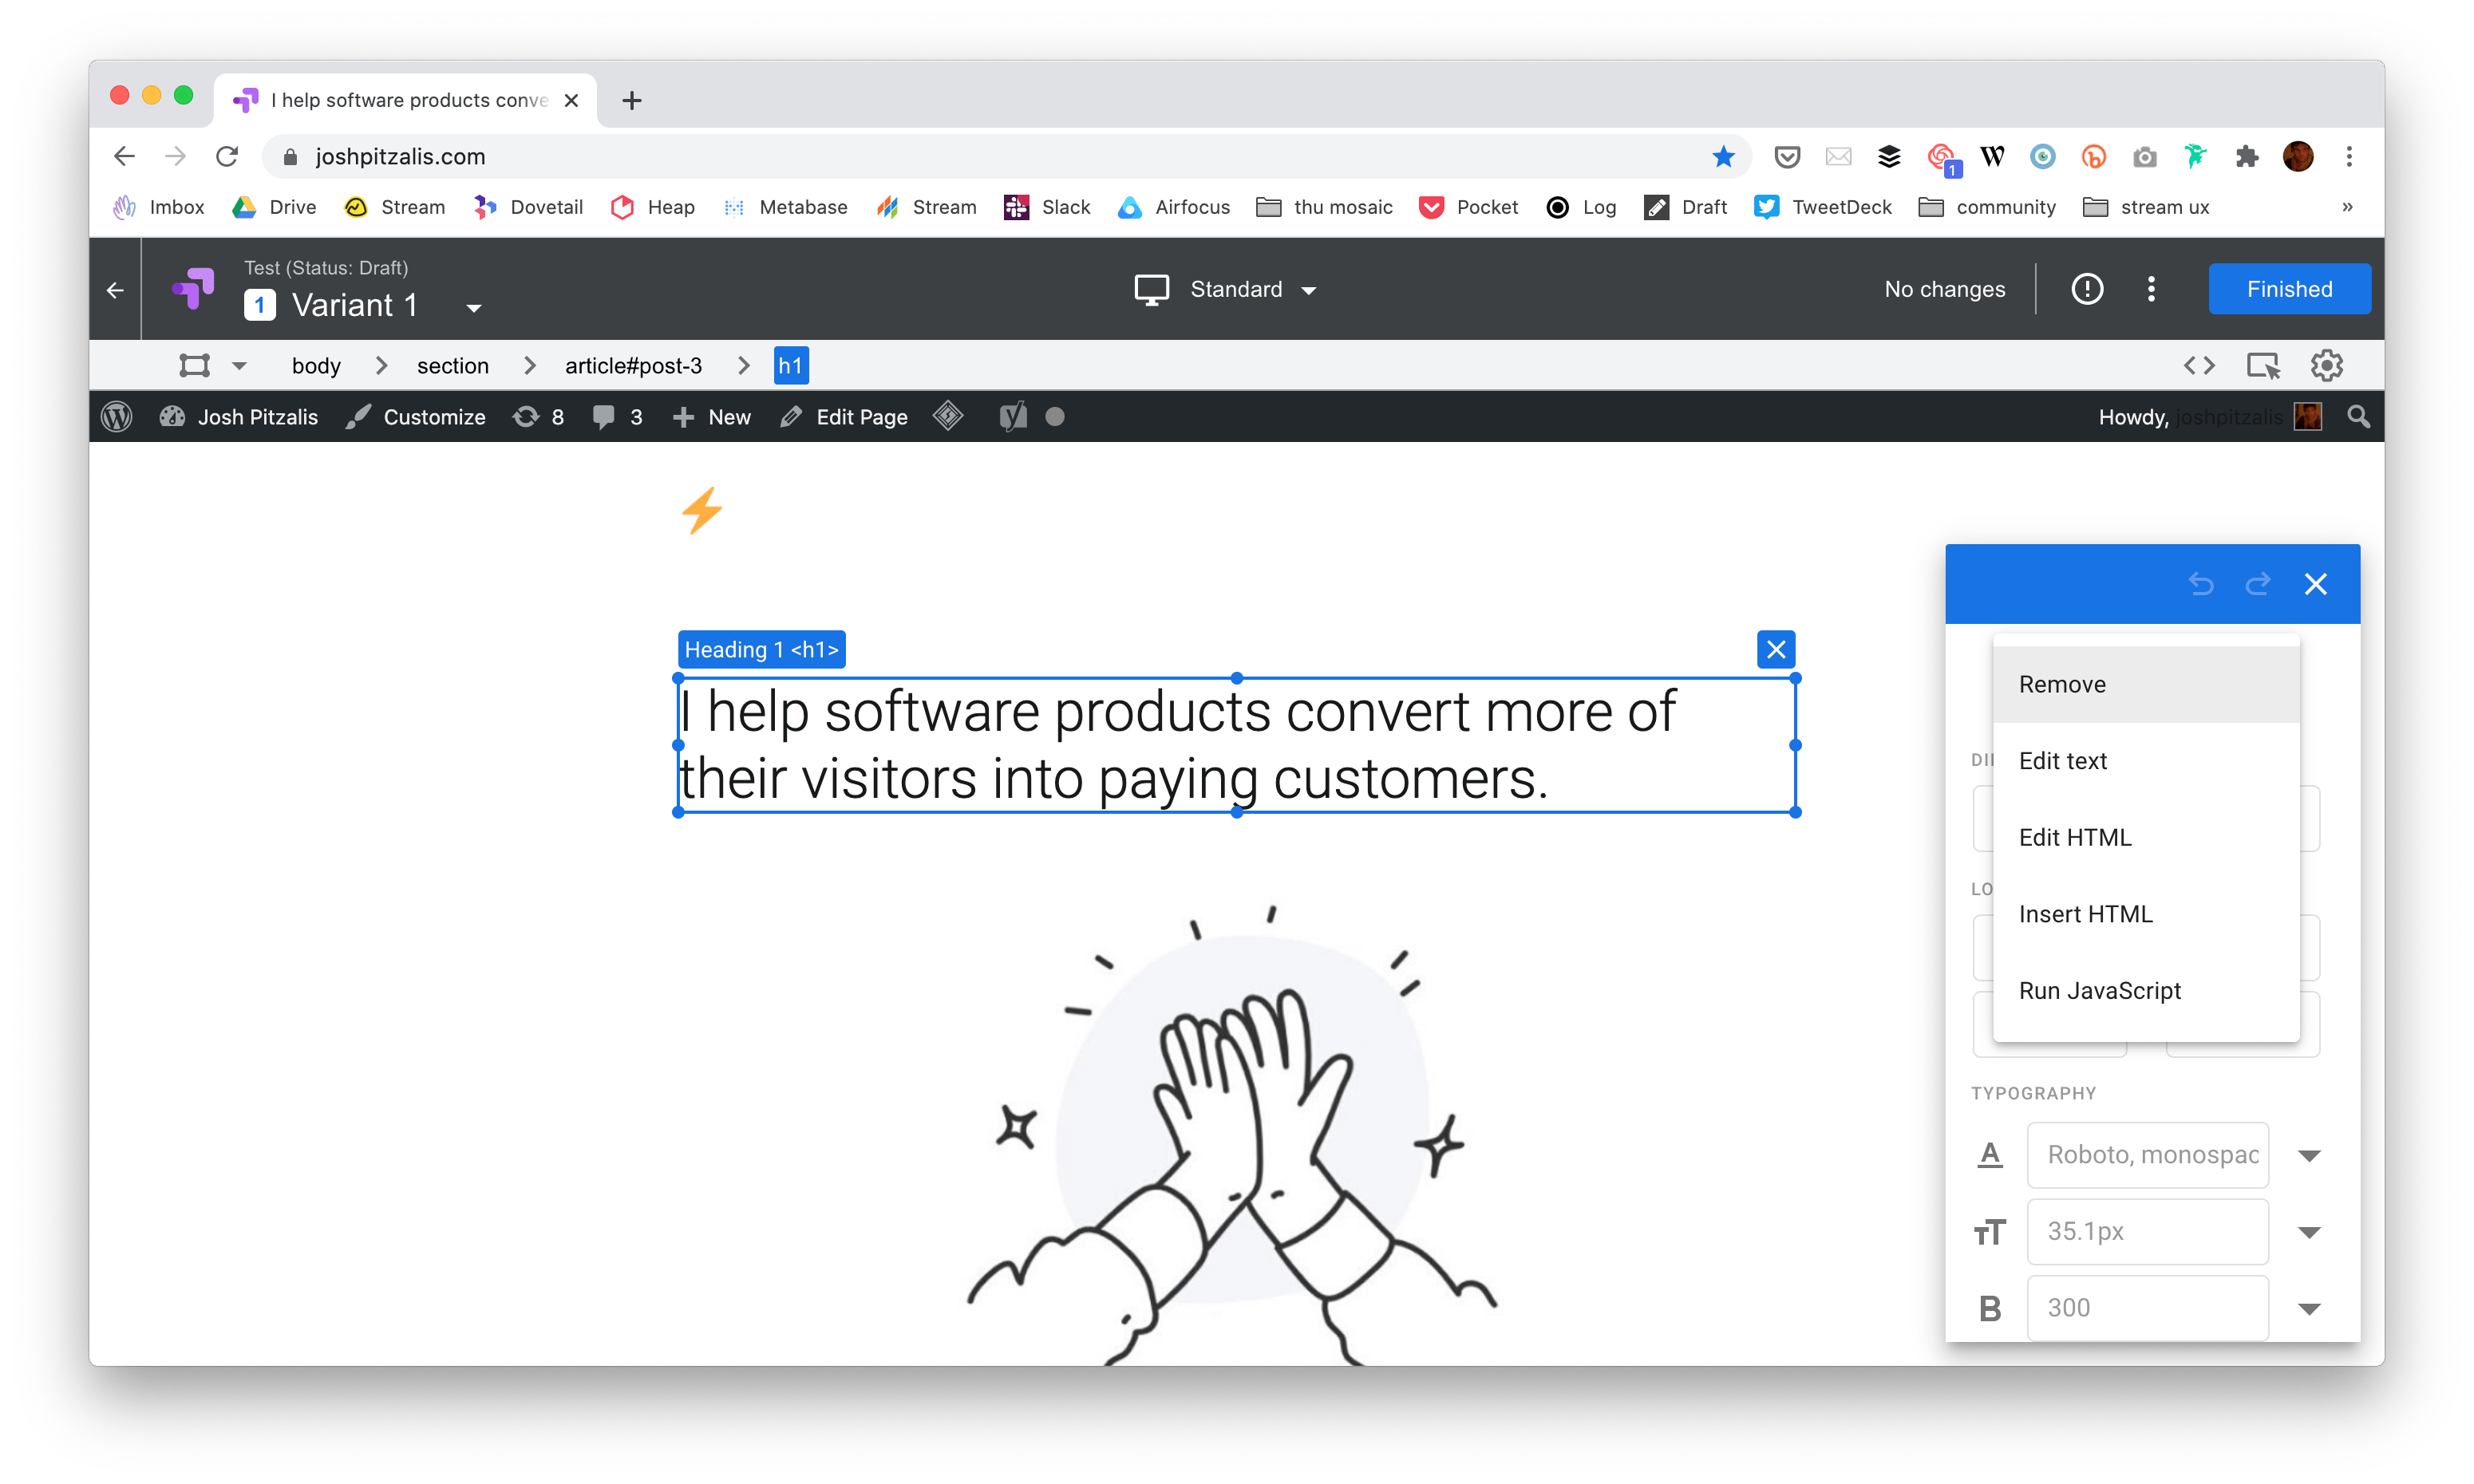
If you decide to do an AB test ( as opposed to a split test) the adding a variant lets you edit the original site in an editor. You can click on headers or paragraphs and change what they say without touching any website code. You can change CSS, add or remove HTML elements, or even add snippets of javascript. The editor is great when you want to make small tweaks to a site. Of you want to make large changes then it probably easier to set up a new website with all the changes and run a split test instead. That way half of your users will see the original site and the other half will the see the new site you have worked on.
Once you are finished you will need to link google analytics to the Optimize account so that it can keep track of where traffic goes.
Finally, you will need to define the goal of your experiment. By default you will be able to measure time on a page, the bounce rate and pages visited. You also have the option to define custom events. This is where you can add an event on your site for form submissions, or a download event, or whatever else you want to track. Once you have defined the goal, you are ready to start the experiment.
Optimise will give you the option to check that your site is properly configured before going live. Configuration means adding an Optimize javascript tag to your site (in addition to analytics tag you already have installed) and an anti-flicker snippet. Google provides links to both during the setup process. Once installed you can run the setup test to make sure your site is working correctly before launching the experiment.
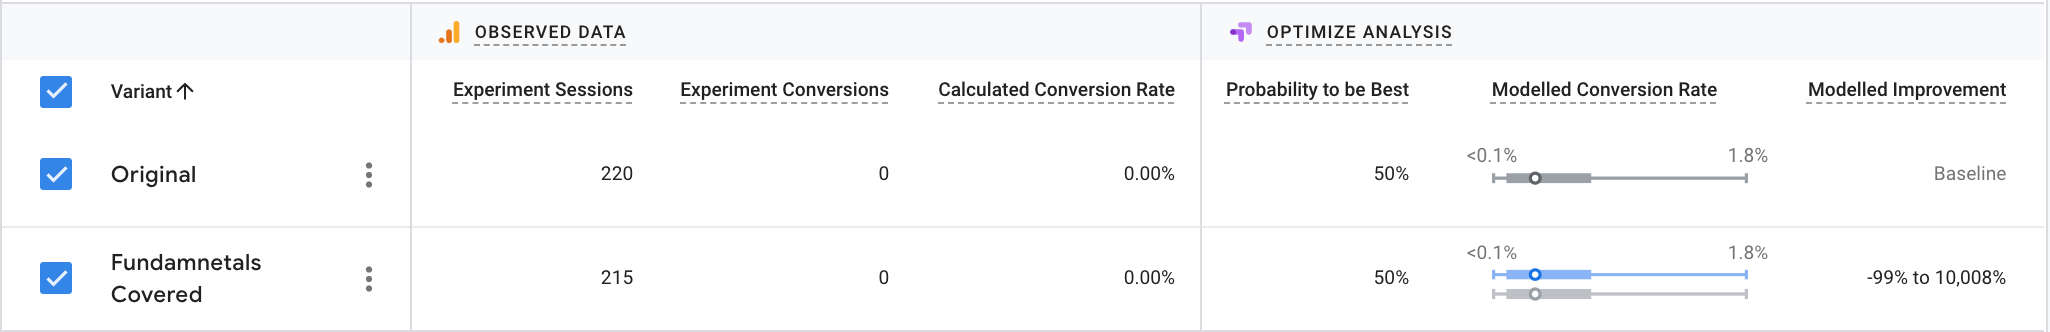
When a test is live you will get a result table like the one above. This shows you how many people are going to each version of the site and how many have converted in each version. I have 0 conversions in the example above so the probability that one version is better than the other is between -99% and 10,008%. As conversions start to come in, this probability starts to narrow until it becomes practical.
SO HOW LONG YOU NEED TO RUN A TEST FOR?#
Imagine you have two dice and you want to check if one is weighted. You roll both dice 10 times. One die seems to be random, the other lands on 3 for more than half of the rolls.
If you check for significance, you’ll get what looks like a statistically significant result. If you stop now and you will think one die is heavily weighted. This is how ending a test early can lead to a significant, but inaccurate, result.
The reality is that 10 rolls is just not enough data for a meaningful conclusion. The chance of false positives is too high with such a small sample size. If you keep rolling, you will see that the dice are both balanced and there is no statistically significant difference between them.
The best way to avoid this problem is to decide on your sample size in advance and wait until the experiment is over before you start believing the results your Google Optimize gives you.
Let’s say you have a website that gets about 1000 hits of traffic a month. About 3% of the people who visit your website sign up to your mailing list. An industry-leading competitor published a case study where adding emojis to their sign up button improved signups.
You want to try emojis out on your website. So you hire someone to set up two versions of your website, the original one, and then a new one with emojis. You A/B test the difference by driving half of your traffic to one side and half to the other. Then you wait to see how many people sign up to the mailing list in each version. After a week, 3 people have signed up through the original and 5 signed up through the emoji version. Clearly, the new variation is an improvement, there is no need to continue testing, now you start driving 100% of the traffic to the new site.
Wrong.
Before you start your test you must calculate how long the test needs to run for before you can call it a success. You plug your data into a ab test duration calculator and it tells you that you need to run the test for 8 weeks.
The actual number for your test depends on your current conversion rate, the size of the change you are trying to detect and how much traffic you get. If you have these variables then this 2 minutes video will show you how to calculate exactly much traffic you need for your site:
I will add another link in the footer showing you how to use the simplest ab test duration calculator I have managed to find.
If you are not convinced that you need to calculate your tests in advance then I recommend running an AA test before you start experimenting.
To set up an AA test you run a regular test but with the exact same website in both conditions. AA tests are painful because they force you to acknowledge just how random and meaningless AB test results can be.
Always calculate your test duration before you start a test.
WHAT DO I TEST THEN?#
What you test is contextual to your project. There is no standard suite of things to test, you need to think about what your product does, who it’s for, and where there is room from improvements path users take to experience the value you offer them.
That said, people of the internet have been building landing pages for a while now and have established a pattern that works. If you are not following these patterns it might be worth running test to see if they can help you improve your conversion rate. Here are 20 questions I ask myself when auditing a landing page.
What does your product do?
- Could a child understand what your product does, based on your headline?
- Does your headline clarify who your product is for?
- Does you byline explain how your product does what it claims to do in ten words or less?
- Does your landing page contain a screenshot, demo or sample of what is being offered?
Why should I care?
- Does your landing page explicitly explain what your product can do for your customer? So benefits in the first paragraph, not features.
- Does the copy clearly explain what advantages your product has over other existing solutions?
- Do you offer anything for free on your landing page?
How do I believe you?
- Does your landing page show proof of benefits (such as case studies) that you promise?
- Do you prominently display icons/images to assure the safety and security of data?
- Does your landing page contain testimonials (or logos) from existing customers?
- Is your landing page on HTTPS?
- Does your landing page offer a guarantee or refund?
- Does your landing page address the most common objections for people?
Where do we begin?
- Does your landing page contain a single offer for visitors to choose from? If you have multiple offers, consider building multiple landing pages so each one is relevant and targeted.
- Is your call-to-action, headline and core benefit located close to each other? Try guiding the visitor by placing important persuasive elements next to each other on the landing page.
- Is your call-to-action above the page fold? To avoid the case of visitors not scrolling down, try moving your call-to-action above the page fold.
- Your call-to-action is obvious twenty steps away from the screen (size, colour, contrast)?
- Does your call-to-action start with a verb and describe what will happen next ( Start trial, See pricing, Join waiting list)? Persuasive text on call-to-action makes it easier for the visitor to think of a reason to click on it.
- Does your landing page have less than three outbound links? Ideally, a landing page should have no external links so that a visitor does not get distracted. -Is your landing page a single-page experience? Single-step landing pages work much better as compared to multi-step landing pages.
The goal here is not to be able to answer YES to all of these questions. The goal is to use these best practices as a starting point for your AB tests. I must emphasise that collecting data on how your customers use your product is the best way to inform what you should test. These questions are only a fallback if you don’t have enough data or if you can’t find any obvious bottlenecks.
Improving conversion is largely a diagnostic process. Diagnostic information typically comes from three places:
- Analytics
- User Testing
- Interviews
Analytics can include all the data you get from Google Analytics or a similar platform. How long people are spending on your site, goal completion rates, where they are dropping off, that kind of stuff. Then there is the more functional aspect to analytical data, like page speed problems, bugs associated with different browsers, server downtime, etc. Broadly speaking, analytical data is about observing what people do in aggregate.
Then there’s user testing. User testing is about observing what individual people do. This can be done in-person or remotely. You give people specific tasks to complete and then watch how well they do and where they get stuck.
Finally, there is qualitative research. This encompasses things like pop-up polls, email surveys, customer interviews, public reviews and live chat interactions (the data your customer support team is already collecting). The best kind of qualitative research comes from speaking to your customers and listening to what they say. Customer interviews won’t solve all your problems but it will help you understand what better means to the people who use your product.
To summarise, in part one of this article, I had a look at what conversion rate optimisation means, I went over what kind of results you can expect from an optimisation program, a framework for thinking about conversion research and the different types of tests there are. In this article, I covered how to calculate your conversion rate and how long you need to run tests for and went over some ideas to get started.
I hope you found this useful and can use the information to start running experiments to improve your conversion. If you get stuck or have question the best place to reach out to me is on twitter @joshpitzalis.
Links#
- Part 1 of this article, Improving Your Conversion Rate (Part 1)
- Vlad Malik’s magnificent reverse sample size calculator.
- Google Optimize https://marketingplatform.google.com/about/optimize/
- A helpful YouTube series to get started with Optimize
- An introductory article on how to do customer interviews
- An introductory article on how to do user testing
- This is post 10 in a series. The rest of the posts are listed here.
- This is the CXL Institute’s conversion rate optimisation program
